Introduction
“At 10 times revenues, to give you a 10-year payback, I have to pay you 100% of revenues for 10 straight years in dividends. That assumes I can get that by my shareholders. That assumes I have zero cost of goods sold, which is very hard for a computer company. That assumes zero expenses, which is really hard with 39,000 employees. That assumes I pay no taxes, which is very hard. And that assumes you pay no taxes on your dividends, which is kind of illegal. And that assumes with zero R&D for the next 10 years, I can maintain the current revenue run rate. Now, having done that, would any of you like to buy my stock at USD64? Do you realize how ridiculous those basic assumptions are? You don’t need any transparency. You don’t need any footnotes. What were you thinking?”
– Scott McNeely, Founder and CEO of Sun Microsystems
The quote above is from an interview McNeely gave to Business Week in 2002, picking over the wreckage of the dot com crash, looking back on the valuations allocated to his company and others in a wildly overheated market. While perhaps missing a growth angle, the above quote does put into perspective how difficult it is to invest in a company at stretched multiples without having absolute conviction in growth prospects.
Historically, it has been quite rare for large-cap stocks to trade at extremely inflated valuations, and the instinctual assumption – ours and that of the financial commentariat – is that these kind of investments don’t typically work out well in the end. But is that actually the case? And what can history tell us about the prospects for these stocks today? While passive investors and Robinhood traders may not concern themselves overly with analytical concepts like enterprise value to sales ratios, should the rest of us care? We will dig into the numbers to answer these questions, as well as discussing the history of the FAANGM1 stocks and the current ‘opportunity set’ or ‘list of offenders’, depending on one’s perspective.
Historical Data and Empirics
Channelling McNeely, and using enterprise value (market cap plus net debt) to sales as our primary indicator, the number of extraordinarily high-priced companies in the Russell 1000 is near record levels (Figure 1), while it is at an all-time high in MSCI World (Figure 2).
Figure 1. Number of Stocks With an EV/Sales Ratio of More Than 10x in R1000 by Sector
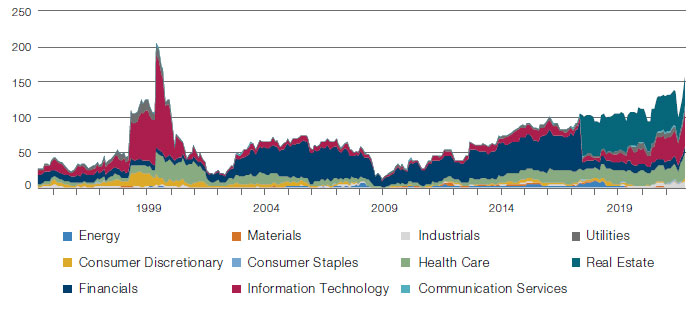
Source: Man Numeric; as of 31 August 2020.
Figure 2. Number of Stocks With an EV/Sales Ratio of More Than 10x in MSCI World by Sector
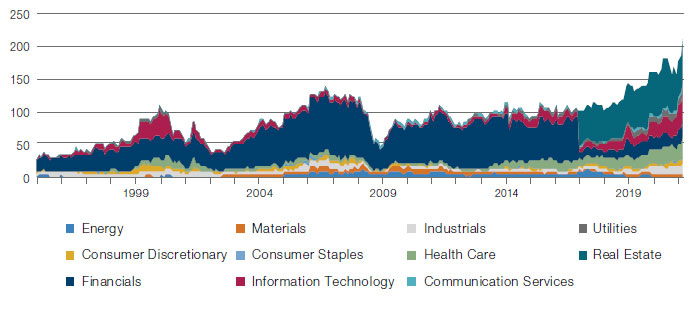
Source: Man Numeric; as of 31 August 2020.
It feels like a good time to be asking how stocks have performed historically when they became this expensive. In short, the answer is: not well, but actually not as badly as one might expect. And that is partially driven by the long-term positive skewness in returns, where a few successes can offset multiple losers. For stocks in the Russell 10002 (MSCI World) whose EV/S ratio exceeds 10 for the first time, the median underperformance is 65% (33%) cumulatively over the next five years. The mean outcome is a bit better – reflecting that positive skewness – with underperformance of 28% and 7%, respectively, for the Russell 1000 and MSCI World.
Figure 3. Excess Cumulative Returns for Stocks With EV/S of More Than 10x in R1000, MSCI World
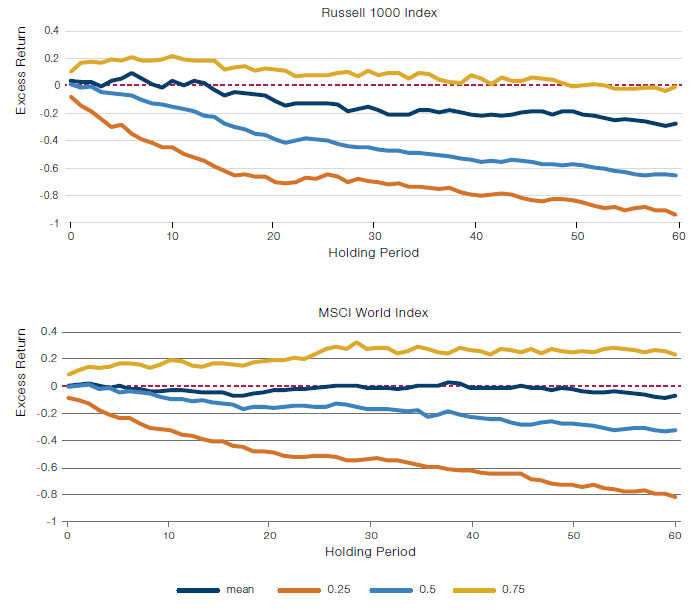
Source: Man Numeric; as of 31 August 2020.
Note: Excludes financials and real estate.
However, if we look at even more extremely valued companies, using 20x as our threshold (and these companies do exist today!), the prospects look dimmer. In the Russell 1000 (MSCI World), cumulative relative underperformance averages 42% (22%). The median cumulative underperformance is 73% (50%)! While it may not be totally fair to say these companies are un-investable, historically the odds have been stacked against them.
Figure 4. Excess Cumulative Returns for Stocks With EV/S of More Than 20x in R1000, MSCI World
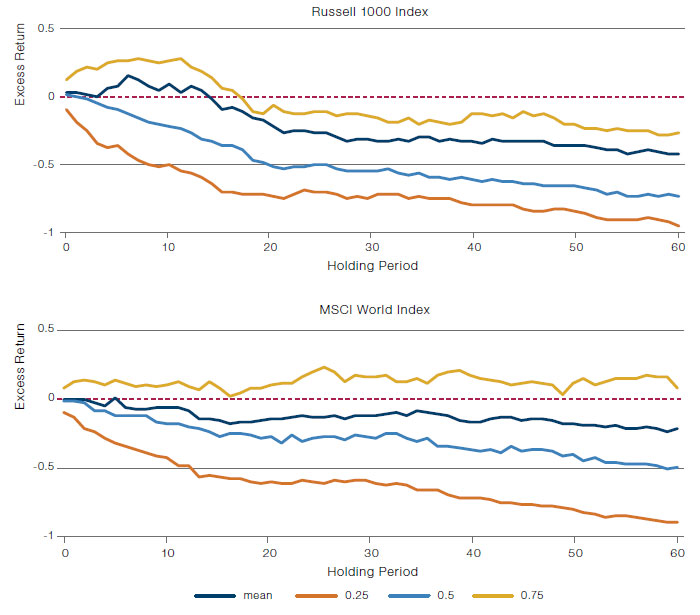
Source: Man Numeric; as of 31 August 2020.
Note: Excludes financials and real estate.
What About the FAANGM Stocks?
Of course, everyone wants to find the next FAANGM stock, and what better place to search than among companies whose obvious potential for growth has led them to be valued at extraordinarily elevated levels? However, the reality is that even the FAANGM stocks only infrequently traded above 10 or 20x sales (Figure 5). Amazon.com traded well north of 10x (and 20x!) during the peak of the tech bubble, but has mostly traded at a more modest multiple over the last two decades (which also makes sense given that historically it was predominantly a low-margin but fast-growing company). Microsoft also exceeded these thresholds during the tech bubble, but has similarly spent most of the last two decades below 10x (although it has approached that level in recent months). Google (aka Alphabet) also exceeded 10x early in its history, although only briefly touched 20x, and Facebook is the only other company to spend meaningful time above the 10x threshold. Today, all of the FAANGM stocks trade at or below 10x sales, and while it is difficult to label them ‘cheap’, the market has plenty of more grievous offenders today.
Figure 5. FAANGM EV/Sales Ratios
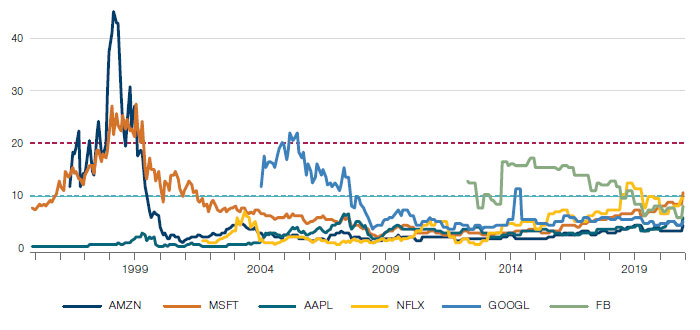
Source: Man Numeric; as of 31 August 2020.
Is it Different This Time?
To those happy holders of stocks trading at egregiously high multiples, there are two material differences between the markets of 2020 and those of history: firstly, the risk-free rate is currently close to zero in developed markets, and, in theory, a company with accelerating growth at a zero discount rate3 has no upper bound on its valuation; secondly, it is clear that return on capital for the best cohort of companies – the FAANGMs, for instance – has entered a new paradigm in terms of the potential for persistence at a higher plateau.
As far as return on equity (‘ROE’) goes, the median company in the top decile of the Russell 1000 (ex-financials and real estate) makes 44%. Assuming growth of 5% into perpetuity (not an ungenerous assumption), and a cost of equity of 6% (long bonds + a 5%-ish equity risk premium, again into perpetuity) the Gordon Constant Growth Model suggests a warranted price to book multiple of 39x. At first blush, very high ROEs and low discount rates do seem to justify eye-watering valuations. But this conclusion rests on the assumption that the current cohort of the most expensive stocks are also the most profitable. And this is manifestly not the case, as Figure 6 shows. The median ROE for the cohort of Russell 1000 stocks with an EV/Sales ratio of more than 10 times has been no better than zero on average since 1999. And for an EV/Sales ratio of more than 20 times, ROE has been materially more negative over time.
Figure 6. Median ROE of Extreme Stocks in R1000
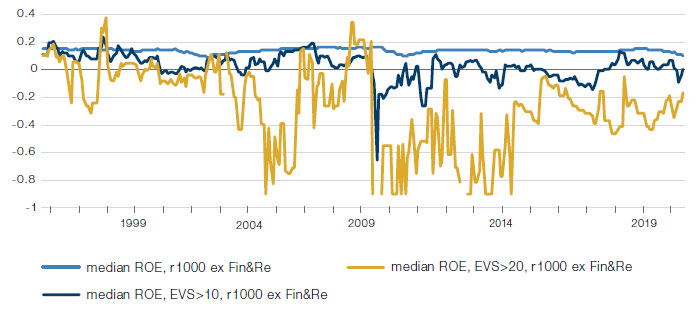
Source: Man Numeric; as of 31 August 2020.
The picture for MSCI World is broadly comparable, as Figure 7 shows.
Figure 7. Median ROE of Extreme Stocks in MSCI World
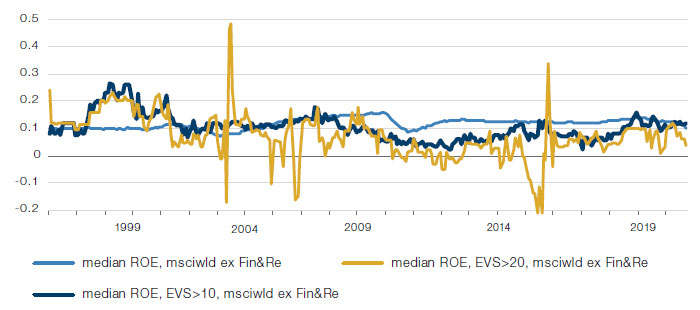
Source: Man Numeric; as of 31 August 2020.
More unfortunately still, the median ROE for the five years after crossing the 10x and 20x sales thresholds does not improve at all for either Russell 1000 or MSCI World, meaning that nothing in history supports the idea that today’s absurdly expensive stocks become tomorrow’s global leaders, at least as far as returns on capital goes.
Conclusion
When an investor is paying 10x, 20x, or more in terms of sales, clearly there is the expectation of significant future growth. The key to success with the FAANGM stocks (and this is written with the total clarity of hindsight) is that investors were not entirely pre-paying for future growth – for the most part, they paid a price that allowed them to benefit from realised future growth. At first glance, it looks like investors in stocks valued at excessive levels are in fact acting rationally. With ultra-low interest rates and persistently high returns on capital for a significant number of companies, and particularly given the high-profile success stories of the FAANGM stocks, it does appear that we may have entered a new paradigm.
Closer inspection suggests that investors ought to exercise caution, however. Looking back over history presents a very different story. Indeed, the exception of the FAANGM stocks appears to mask a more powerful and persistent truth: that stocks valued at excessively high levels very rarely deliver the kind of earnings to justify these inflated prices. There appears to be little relationship between sky-high multiples and persistently high return on capital; if anything, companies with such excessive valuations tend to produce lower returns over time. It feels unfashionable in the age of the unicorn to suggest that fundamentals matter, that the valuation techniques we learned in school still hold water, that it’s not a great idea to buy stocks at 20x EV/S. But a close analysis of historical precedent presents us with precisely these lessons, and we urge long-term investors to think hard before launching into the frantic scramble to uncover the next FAANGM miracle stock.
1. Facebook, Apple, Amazon, Netflix, Google, and Microsoft.
2. Excluding financials and Real Estate.
3. Of course, a zero risk free rate is not the same as a zero discount rate. There’s the small matter of the equity risk premium.
You are now leaving Man Group’s website
You are leaving Man Group’s website and entering a third-party website that is not controlled, maintained, or monitored by Man Group. Man Group is not responsible for the content or availability of the third-party website. By leaving Man Group’s website, you will be subject to the third-party website’s terms, policies and/or notices, including those related to privacy and security, as applicable.