Inflation: Permanent or Transitory? Survey Says…
The year-over-year base effect that increases inflation numbers compared with the Covid-19-induced global recession will pass. The intensity of the Covid-19 crisis will also pass, as the world gets vaccinated or immune, and virus mutations may become less lethal. Supply bottlenecks will likely ease, too.
As such, the higher inflation numbers are transitory.
Or so the surveys say, whether conducted by Good Question (Man Group’s partnership with the Good Judgement Superforecasting team), Bank of America Merrill Lynch or Deutsche Bank.
We beg to differ. We believe the likelihood of a future with higher and more volatile inflation has increased. Why? In one word: policy.
Our study of historical inflation regimes concludes that policy dominates other drivers. For instance, the wage-price spiral was still in place when Paul Volcker became Chair of the Federal Reserve in August 1979, and the US CPI printed 11.8%. But his committed policy to tame inflation changed everything.
Addressing climate change and inequality are likely to be inherently inflationary. Sustained fiscal deficits facilitated by monetary authorities can be inflationary too, although it depends on what it is spent on, and its corresponding multipliers. Central banks allowing for inflation overshoots, and waiting for higher inflation rather than anticipating it, represents a new force in the same direction. And the more the authorities allow this, under the guise of not being concerned about the long-term consequences, the more likely it is that there will be long-term inflationary consequences. Note that we did not even mention the role of peak globalisation and demographics.
“Excluding used car prices, the inflation picture is much more benign” is the kind of phrase we hear often from market commentators. Yes, excluding the bad stuff everything tends to look good! “Money supply growth (‘M’) is already slowing, again” is another statement we hear regularly, quite often from those who ignored money supply when it surged. To that, we say a narrow focus on money supply risks missing the bigger picture by ignoring the velocity of money (‘V’), the much maligned, elusive component of MV=PQ.
We also hear that “it is only in the US that sustained fiscal spending seems to be happening”. To this, we say it is normal for one country to take the lead in the process of seismic changes, as we seem to be witnessing now. There were six years between the UK devaluing against gold in 1931, and France eventually following as the last major country to do so in 1937; quantitative easing was quickly adopted in the US in 2008, while the “whatever it takes” Draghi moment in the Eurozone occurred four years later in 2012. Indeed, if President Joe Biden’s policy of sustained fiscal spending contributes to the intended policy goals, and if it transpires that spending money wins votes in the mid-term election of 2022, then it seems likely to us that other countries will follow.
Hedging Activity Robust Even as Volatility Fell in August
S&P 500 weekly implied volatility fell to 6.6 on 13 August, levels last seen in 2017, driven by two main reasons: (1) relatively low realised volatility; and (2) a large supply of short-dated options from volatility sellers from various ETF and short volatility strategies looking to add ‘yield’ to portfolios from short options.
Figure 1. S&P 500 Weekly Implied Volatility
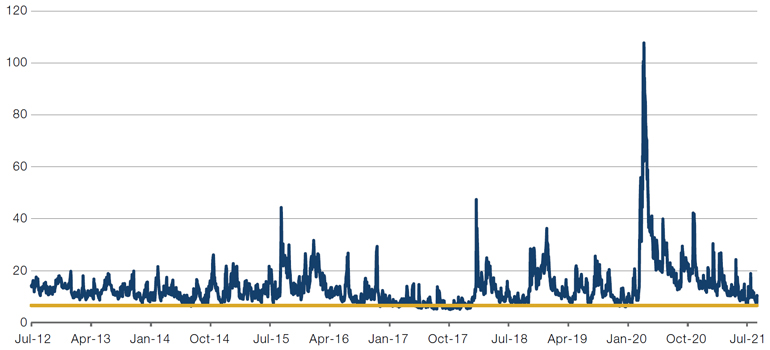
Source: Bloomberg; as of 18 August 2021.
Despite short-dated at-the-money implied volatilities falling, hedging activity – as determined by equity skew – has been very robust.
Skew is a measure of the implied volatility of out-of-the-money puts versus as-the-money or out-of-the-money implied volatility. The higher the skew, the more demand for calls or, potentially, higher supply of calls. Both are effectively hedges, with call sales capping upside and put buys capping downside.
Contrary to short-dated volatility, skew levels are in the 95-99th percentile in the S&P 500 and Euro Stoxx indices. Figure 2 compares 3-month 90% put to 3-month 105% call implied volatilities. High hedging flows have puts at relatively expensive levels.
Figure 2. Three-Month 90% Put Compared With 105% Call
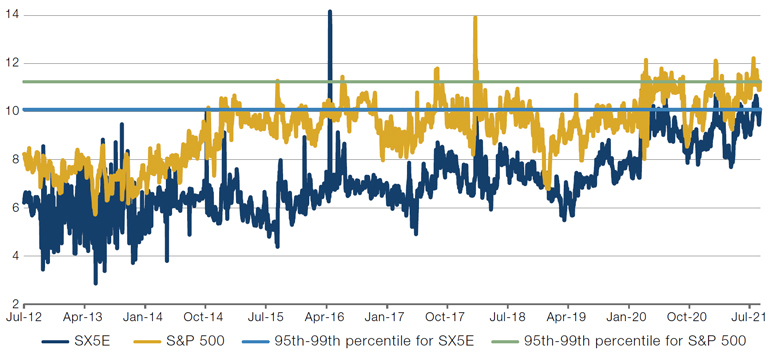
Source: Bloomberg; as of 18 August 2021.
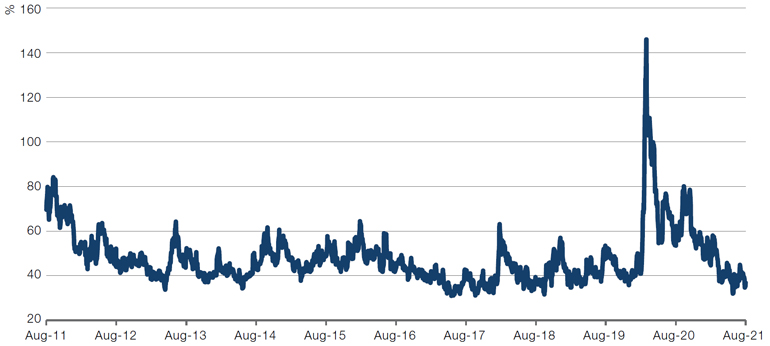
This, in turn, feeds through to the VIX Index, which also has yet to fall to 2017 levels due to demand for downside puts. In this case, we look at the VVIX Index, which measures the volatility surface of options on the VIX (Figure 3). The higher the VVIX relative to the VIX, the more demand for hedging.
Despite the VIX being relatively high, call buying on the index has been robust. In short, hedgers are buying relatively expensive options on the VIX (which itself is relatively expensive to short-dated at-the-money options).
Figure 3. VVIX-VIX Levels
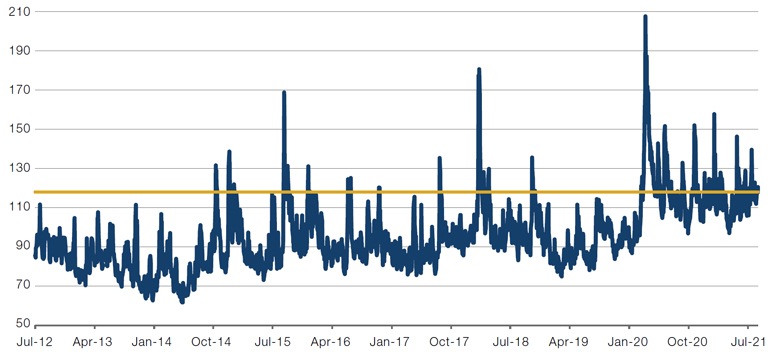
Source: Bloomberg; as of 18 August 2021.
Expectations for Persistence of Factor Volatility Remain High
While S&P 500 volatility has not been pronounced, underlying movement among sectors and factors have remained volatile. Indeed, factors such as Value, Size and Momentum have had sharp reversals over the last two years.
Separately, 1-month implied volatility on the Russell 2000 versus the S&P 500 reflects the very high realised volatility of small-cap stocks since the pandemic began, but also the expectation that it won’t normalise any time soon (Figure 4). This is not to imply that investing in factors is a poor choice, but rather that expectations for persistence of factor volatility remains much higher than for the broader market.
Figure 4. One-Month Implied Volatility — Russell 2000 Versus S&P 500
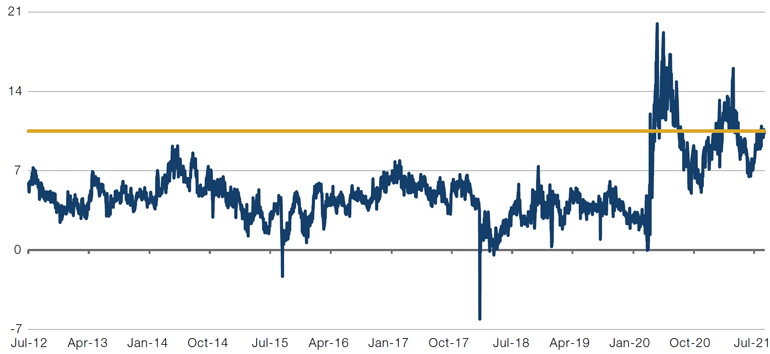
Source: Bloomberg; as of 18 August 2021.
This is not to say that all asset classes reflect hedging or higher demand for volatility products. Implied volatility on credit indices are near their lows (Figure 5). Since the Federal Reserve announced programs that could buy credit in dislocations, equity implied volatility has persistently stayed at relatively high levels, compared with credit volatility. While this may imply that market expectations are for smaller dislocations in credit given Fed support, we believe that those expectations miss a whole range of negative outcomes ranging from impacts of inflation, tapering and potential rate hikes to solvency and downgrade issues in the next crisis.
Figure 5. Implied Volatility on Credit Indices Near Lows
Source: Bloomberg; as of 18 August 2021.
With contribution from: Teun Draaisma (Man Solutions, Portfolio Manager), Ben Funnell (Man Solutions, Portfolio Manager), Campbell R. Harvey (Man Group, Investment Strategy Advisor) and Peter van Dooijeweert (Man Solutions, Managing Director).
You are now leaving Man Group’s website
You are leaving Man Group’s website and entering a third-party website that is not controlled, maintained, or monitored by Man Group. Man Group is not responsible for the content or availability of the third-party website. By leaving Man Group’s website, you will be subject to the third-party website’s terms, policies and/or notices, including those related to privacy and security, as applicable.