Quote of the Week:
"When it's [inflation] too high, people are going to cry. When it's too low, the economy can't grow."
The End of Two Percent Inflation Targeting
At the Jackson Hole Economic Symposium, Jerome Powell, Chairman of the Federal Reserve, announced a move to “average inflation targeting”, replacing the pre- existing policy of targeting 2% annual inflation as measured by the Consumer Price Index. The new regime would instead allow the central bank the flexibility to “catch- up” by allowing inflation to run higher than the traditional 2% target to compensate for any previous inflation undershoot. This aims to combat a serious problem: the annualised inflation shortfall since 2009 has been around 7%, representing around USD1.5 trillion in lost nominal GDP by the end of 2019 (Figure 1).
Figure 1. US Inflation Undershoot
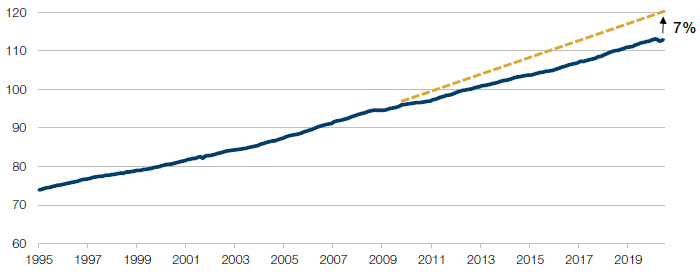
Source: Bloomberg; as of 28 August 2020.
Primary dealers appear to have complete confidence in the Fed’s forward guidance, with total belief that the current Fed funds rate of 0.13% will still be in place until the first half of 2024 (Figure 2). This is reflected in the price of the 10-year 10-year USD swap, which gives the expected 10-year rate in ten years’ time – i.e. the 10-year rate in August 2030 (Figure 3). Currently at 1.28%, the market anticipates negative real rates on the long end of the Treasuries curve. Negative real rates is what the Fed wants, to encourage capital to reallocate from cash and Treasuries into higher return assets, or better still real projects. However, the success or failure of this departure in policy will depend on whether inflation expectations can move higher. And while the Fed has absolute credibility on policy rates, confidence in its ability engender inflation is less obvious (Figure 4). This will probably require the consistent expansion of fiscal spending, too.
Figure 2. Primary Dealers Expectation of Change to Target Range of Federal Funds Rate
| Earliest half-year period | |
|---|---|
| 25th Percentile | H1 2024 |
| Median | H1 2024 |
| 75th Percentile | H2 2024 |
| # of Responses | 17 |
Source: Federal Reserve Bank of New York; as of 20 July 2020.
Figure 3. 10-year 10-year USD Forward Swap (%)
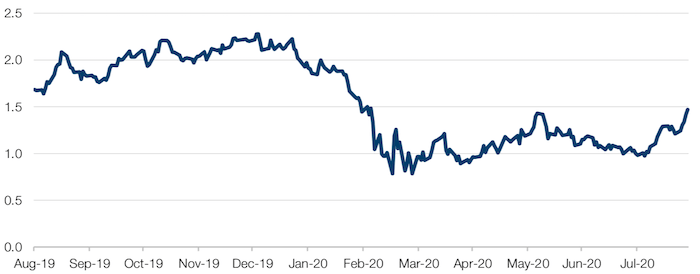
Source: Bloomberg; as of 28 August 2020.
Figure 4. Primary Dealers Expectations for Output, Inflation and Unemployment
| 2020 | 2021 | 2022 | Longer Run | ||
|---|---|---|---|---|---|
| Real GDP (Q4/Q4 Growth) | 25th Percentile | -6.35% | 3.70% | 2.15% | 1.75% |
| Median | -5.40% | 4.55% | 2.75% | 1.90% | |
| 75th Percentile | -4.05% | 5.10% | 3.00% | 2.00% | |
| Core PCE Inflation (Q4/Q4) | 25th Percentile | 0.80% | 1.25% | 1.50% | - |
| Median | 0.90% | 1.50% | 1.70% | - | |
| 75th Percentile | 1.10% | 1.80% | 2.00% | - | |
| Headline PCE Inflation (Q4/Q4) | 25th Percentile | 0.50% | 1.35% | 1.65% | 2.00% |
| Median | 0.75% | 1.55% | 1.80% | 2.00% | |
| 75th Percentile | 1.00% | 1.95% | 2.00% | 2.00% | |
| Unemployment Rate (Q4 Average Level) | 25th Percentile | 8.35% | 6.20% | 4.50% | 4.00% |
| Median | 9.15% | 6.70% | 5.10% | 4.10% | |
| 75th Percentile | 9.85% | 7.45% | 6.00% | 4.50% | |
Source: Federal Reserve Bank of New York; as of 20 July 2020.
Plenty that we read suggests a consensus view that persistent negative real rates will lead to more of the same: Growth outperforming Value, and the failure of mean reversion strategies. But historical performance suggests otherwise (Figure 5). In the 1940s and 1970s negative real rates coincided with the outperformance of Value and periods where mean reversion of prior losers worked well (as represented by the Fama-French Long-Term Reversal factor).
Figure 5. Value and Long-Term Reversal versus 3-Month Real Rates
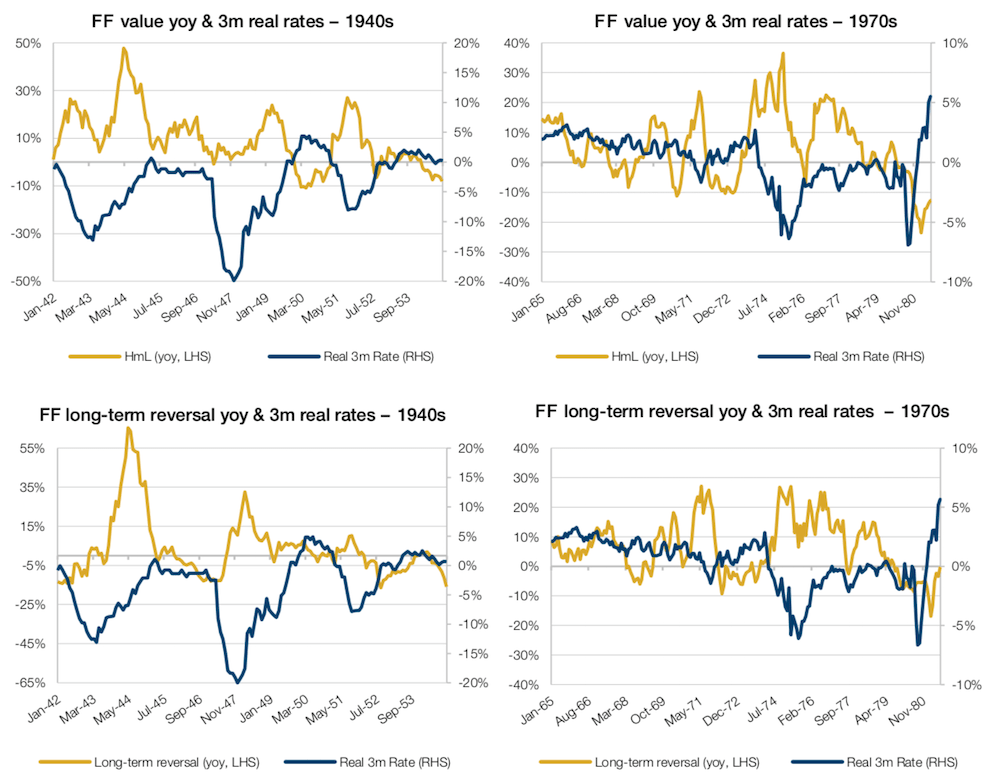
Source: Man GLG; as of 25 August 2020.
Timber! The Delinquent Mortgage Market that Can’t Stop Building
The US housing market is simultaneously delinquent and booming, reflecting both the short-term impact of the coronavirus crisis and ongoing secular shifts in the shape of American households.
First, the National Association of Home Builders (‘NAHB’) Housing Market Index, a measure that takes the pulse of the US single-family housing market through monthly survey of homebuilders. The survey asks builders to rate the status of current sales, sales for the next six months and traffic of prospective buyers on a scale and then provides a seasonally-adjusted measure between 0-100. The NAHB Index is now approaching multi-decade highs, well above the levels seen prior to the Global Financial Crisis (‘GFC’).
Figure 6. National Association of Home Builders Housing Market Index
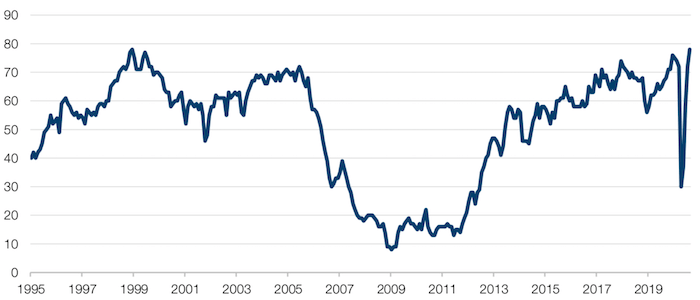
Source: Bloomberg; as of 26 August 2020.
This construction boom has been driven by record low mortgage rates and secular demographic changes to patterns of demand for housing (with millennials moving out of inner-city multi-family and into single-family suburb and exurb properties). The surge in building, twinned with a lockdown-related rise in renovations and home improvements, has led to a spike in lumber prices so large that it made this the best- performing commodity of 2020.
Earlier this summer, we noted the worrying state of US mortgage confidence indicators. Sure enough, US mortgage delinquency rates have risen to levels not seen since 2011, standing currently at 8.22%, a figure that is only expected to worsen as unemployment insurance rolls off. These delinquencies have been driven by Federal Housing Administration loans – those offered to first-time buyers without large down- payments. Crucially, banks are being made to take the pain for many of these delinquencies as the CARES Act forces them to offer forbearance on loans past due.
Figure 7. US Mortgage Delinquencies
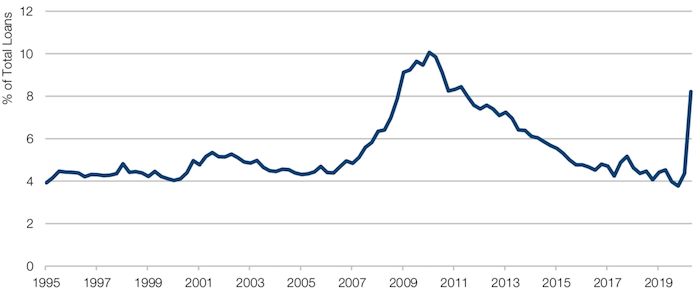
Source: Bloomberg; as of 26 August 2020.
With contribution from: Ed Cole (Man GLG, Managing Director – Equities).
You are now leaving Man Group’s website
You are leaving Man Group’s website and entering a third-party website that is not controlled, maintained, or monitored by Man Group. Man Group is not responsible for the content or availability of the third-party website. By leaving Man Group’s website, you will be subject to the third-party website’s terms, policies and/or notices, including those related to privacy and security, as applicable.