Quote of the Week:
"The observation that major companies don’t survive radical technology shifts is absolutely axiomatic in all sectors. There’s a reason why GM doesn’t lead the electric car revolution; there’s a reason why we don’t use Yellow Pages for our search functions; there’s a reason why we buy our stuff from Amazon... It’s just hilarious to hear the kind of arguments that have been made by these incumbents, that they can suddenly dance and turn."
Market and Election Volatility
Options markets are often used as a barometer for the price of uncertainty. The CBOE Volatility Index (‘VIX’) tends to reflect sharp movements in short dated equity prices, while VIX futures reflect somewhat longer expectations of price volatility. In periods of relative stability, the VIX is often quite low, with 2-month VIX futures trading higher than the VIX, as market participants perceive the possibility of a surprise over the next few weeks to be lower than over the next few months. In periods of high volatility, the opposite tends to occur, with the market anticipating periods of high volatility to be immediate and persistent for a short period before giving way to lower volatility. As such, the second-month VIX future (a measure of where 1-month implied volatility will be in two months’ time), gives a fair indication of the market’s perception of risk and how long periods of volatility might last.
Even as markets have recovered, VIX futures have remained persistently elevated as uncertainty around Covid-19, vaccines, economic data and the election have combined with increased retail flows in tech options to support option prices. As Figure 1 shows, VIX futures have maintained persistently high levels even as equities have recovered to their highs. Perhaps more telling is the spread between the VIX future and realised volatility, which remains at the highest level since the Global Financial Crisis (‘GFC’). The implication is that demand for options remains high even as realised volatility and market levels have improved.
The relative richness of the implied volatility to realised volatility may be masking a key warning from the options market: the biggest fear in the market is not the actual result, but the possibility that the result will be disputed or uncertain for a prolonged period after the election. Presently, options expiring on 4 November are pricing two volatility points below those expiring on 18 December. Typically, options price in sharper movements for expirations immediately following the election than for those expiring in weeks or months beyond the date. That higher volatility is meant to compensate sellers of volatility for the potential large gap movements around the event as shorter dated options at a lower vol would have too little time value remaining to protect against the price shock. The current pricing of December- expiring options at a premium to 4 November suggests the volatility markets are expecting sustained volatility well beyond the date.
For all the debate about whether a Democratic sweep may be good for markets based on stimulus or bad for markets due to higher taxes, the options market seems to be suggesting that any clear result is better than no result. As such, a clear winner, regardless of party, may be enough to lower volatility across maturities and thus potentially lead to a reduction in the equity risk premium.
Figure 1. Second Month VIX Future Versus 2-Month Volatility Spread
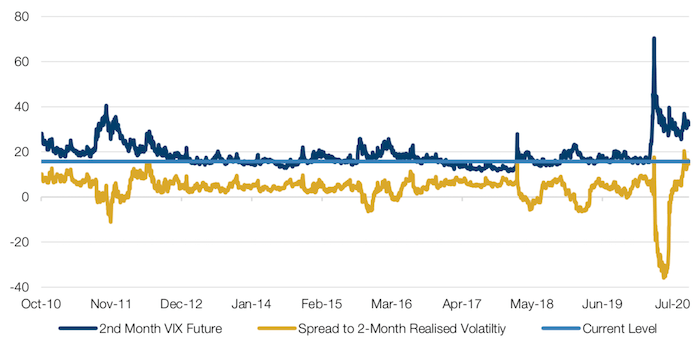
Source: Bloomberg; as of 30 September 2020.
Vaccine Progress Doesn’t Equal Recovery
Last week, we discussed how the expectations of the Good Judgement Project’s Superforecasters were declining for when a coronavirus vaccine might become generally available in the US. As a follow on, it is worth examining the progress of vaccine trials up to this point.
We would identify four front-runners in the race for a vaccine: the trials run by Pfizer/BioNTech, Moderna, AstraZeneca and Novavax. At this point, it is worth stressing that we don’t expect the development of a vaccine to have a material effect on the profitability of the companies in question, as we have previously discussed. All four have started Phase Three trials, with some interim data expected as early as October 2020. So far, all front-runners have demonstrated reasonable levels of neutralising antibody titers (the measurement of how much antibody organisms produce in response to pathogens) and safety levels. The durability of all four vaccines remains a concern, and not all have produced the full scope of T-cell responses needed from the immune system. Manufacturing capacity is likely to remain a key bottleneck, but could reasonably be expected to be ramped up by mid- 2021.
However, there are key caveats. To become approved by the US Food and Drug Administration (‘FDA’), a vaccine would need to demonstrate efficacy of above 50% i.e. it would need to reduce the number of symptomatic coronavirus cases by 50%. This threshold in itself shouldn’t be difficult to achieve: vaccines which shows low levels of effectiveness (of around 60% or below) are usually those for diseases with multiple strains circulating at the same time such as flu or pneumonia. Since Covid- 19 has only one strain, vaccines are likely have an effectiveness of above 90% if they work at all. However, it is important to remember that herd immunity depends on both the effectiveness of the vaccine and its uptake. If for instance, ‘herd immunity’ could be achieved with 60% immunity, you would need to immunise either 60% of the population using a 100% effective vaccine, or 100% of the population with a 60% effective vaccine. Whilst we might conceivably see an FDA-approved vaccine by the end of year, when we consider the vocal anti-vaxxer movement, the bar for efficacy is much higher than the FDA’s 50% threshold and leave us a wide range of potential scenarios to consider.
How does this relate to our Superforecasters? Well, it again reinforces the need for probabilistic thinking, weighting both the effect of an approved vaccine on the global economy, and the likely effectiveness of the leading candidates as more data emerges. Rather than assuming that a vaccine equals economic recovery, investors need to consider a range of likely scenarios.
A Contrarian Long?
Commodity Futures Trading Commission data indicates that a large short position has built up in Nasdaq index futures (Figure 2).
This has historically been a contrarian indicator for investors to go long. As a rule of thumb, if net short positions go below -10%, history shows that the index will rise over the coming months. Net short non-commercial futures have reached almost -40%.
In short (if you’ll excuse the pun), it is worth considering that bull markets run from recession to recession. We’ve just had one recession, so the fall in the Nasdaq may well be temporary.
Figure 2. Nasdaq Net Non-Commercial Futures / Total Open Interest
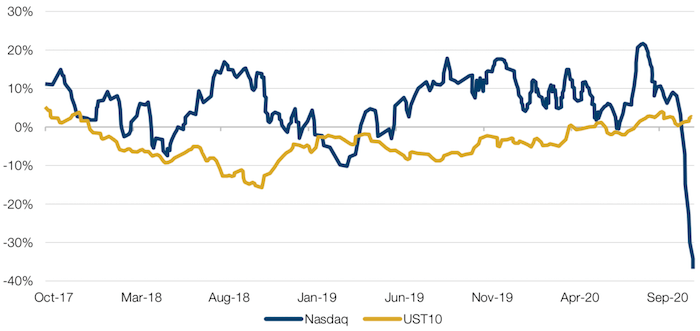
Source: Source: Bloomberg, CFTC; as of 1 October 2020.
With contribution from: Peter van Dooijeweert (Man Solutions, Managing Director), James Terrar (Man GLG, Analyst), Henry Neville (Man Solutions, Analyst), Teun Draaisma (Man Solutions, Portfolio Manager) and Ben Funnell (Man Solutions, Portfolio Manager).
You are now leaving Man Group’s website
You are leaving Man Group’s website and entering a third-party website that is not controlled, maintained, or monitored by Man Group. Man Group is not responsible for the content or availability of the third-party website. By leaving Man Group’s website, you will be subject to the third-party website’s terms, policies and/or notices, including those related to privacy and security, as applicable.