Quote of the Week:
"I do not want to burden this future."
Waiting on V
Inflation is defined as a persistent increase in the general price level. But how does it actually operate? The quantity theory of money explains inflation as:
$M \times V = P \times Q$
where M represents the quantity of money, V the velocity of money, P the general price level and Q the quantity of goods produced. Basically, for an increase in the general price level, we would expect to see an increase in both the quantity of money and its velocity, assuming that the quantity of goods is constant.
Since the onset of the coronacrisis, we have been discussing the inflationary implications of both the fiscal and monetary actions we’ve seen in the US. Indeed, this intervention has led to the monetary base1, or the ‘M’, increasing by about 50% year-on-year2 (Figure 1).
But of course, it takes two to tango in inflation: the monetary base and its velocity. And with such a rapid increase in the size of the US monetary base, an uptick in monetary velocity could well herald inflation. The world is waiting on V.
Figure 1. US Monetary Base
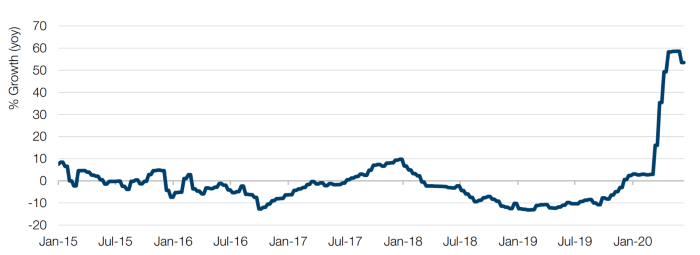
Source: Bloomberg; as of 17 June 2020.
Surprise, Surprise
The Citi US Economic Surprise Index (‘ESI’), which measures the degree to which economic data is coming in relative to economist expectations, is at an all-time high.
Figure 2 shows that there is a reasonably positive correlation between the ESI and the excess returns of the S&P500 Index over Treasuries. Indeed, we don’t think that it’s a coincidence that from the lows in April, both the ESI and the outperformance of stocks versus bonds have seen sharp recoveries. However, the ESI is a mean- reverting index and as it starts to come lower, we may start to see the momentum of the outperformance of stocks versus bonds start to ebb.
It’s also a similar story for the correlation between the ESI and the excess return of high vol versus quality. As momentum in ESI starts to ebb, we believe the impetus for taking risk in high short-interest or junk stocks may start to ebb a little (Figure 3).
Figure 2. ESI Versus Excess Returns of the S&P500 Index Over Treasuries
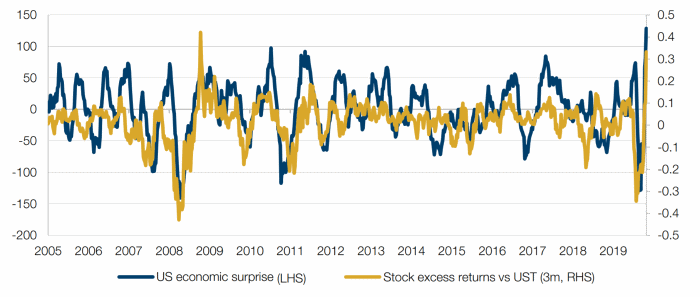
Source: Man GLG; as of 22 June 2020.
Figure 3. ESI Versus Excess Return of High Vol Over Quality
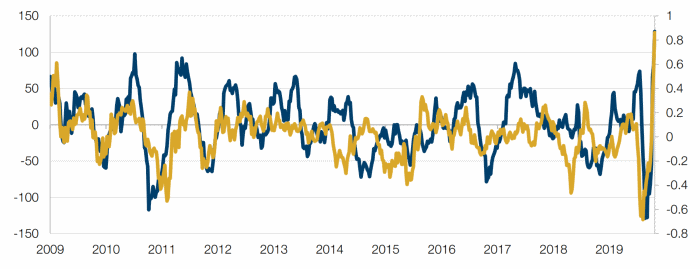
Source: Man GLG; as of 15 June 2020.
Where Might Corporate Taxes Hit?
As fiscal deficits rise in response to the coronavirus, it is likely that governments around the world will be looking at all different types of avenues to recoup the costs, one of which could be the corporate tax rate.
Figures 4 and 5 shows the effective corporate tax rates in the US, broken down by sector and market cap, respectively. The yellow bar shows the statutory rate of tax, while the light blue bar is the weighted average tax rate. The first observation is that effective tax rates are typically lower than statutory tax rates, underlying the degree to which companies use tax optimisation strategies.
From a sector perspective, and excluding real estate (because of the tax considerations of REITs), the information technology and health-care sectors – which incur high research and development costs – benefit from a lower effective corporate tax rate (Figure 4).
From a market-cap perspective, the largest stocks have a higher effective tax rate than the smallest stocks – although the five largest US stocks all have an effective rate lower than the both the statutory rate, and the effective rate for the index (Figure 5).
Additionally, more than a quarter of US companies’ income come from foreign direct investment (‘FDI’) geographies associated with tax optimisation (Figure 6), while cumulatively, FDI from these regions have totalled about USD1.5 trillion over 25 years (Figure 7).
Figure 4. Effective Tax Rates by Sector
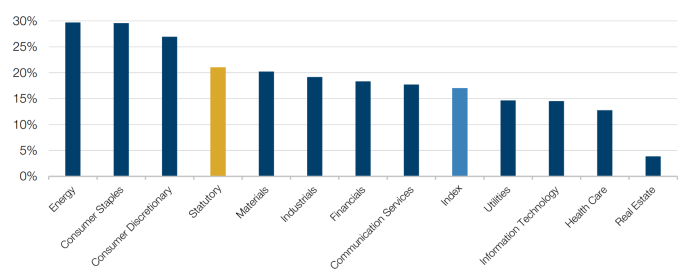
Source: Bloomberg; as of 22 June 2020.
Figure 5. Effective Tax Rates by Market Cap Quintile
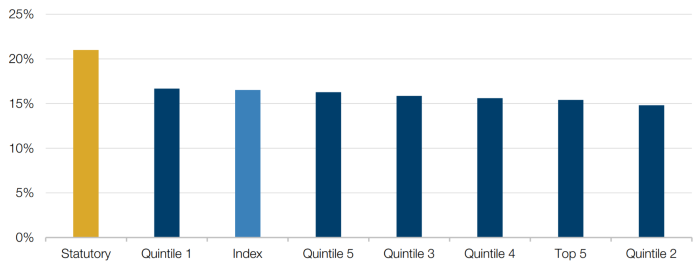
Source: Bloomberg; as of 22 June 2020.
Figure 6. Four Quarters of Rolling Income from Overseas Foreign Direct Investment (USD Billion)
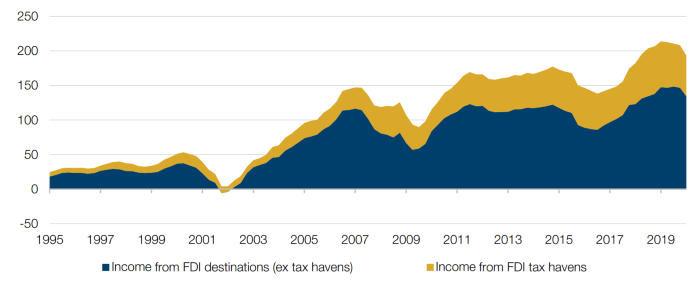
Source: Man GLG; as of 31 March 2020.
Figure 7. Cumulative FDI (USD Trillion)
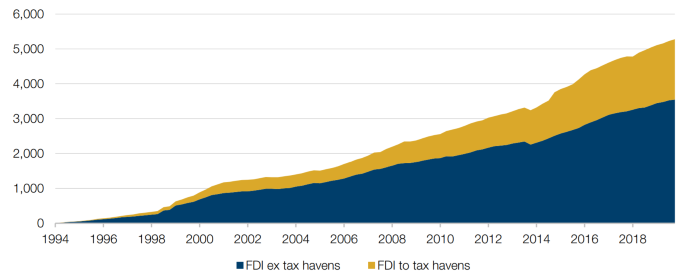
Source: Man GLG; as of 31 March 2020.
Slowly Back To Normal
In response to coronavirus, a large number of central banks took out FX swaps with the Fed. These are now being unwound (Figure 8), with the biggest delta being the reduction in EUR/USD swaps taken out by the European Central Bank.
EUR/USD and JPY/USD basis swaps have not moved much while this unwind has happened, suggesting that there is not an unmet need for US dollars in European and Japanese banking sectors.
Whilst this is not a definitive sign that funding markets are healed, normal behaviour in cross-currency basis swaps at the same time that provision of dollar liquidity is reduced suggests that markets are functioning, and that we might be slowly making our way back towards a semblance of normality.
Figure 8. Fed Outstanding Liquidity Swap Operations
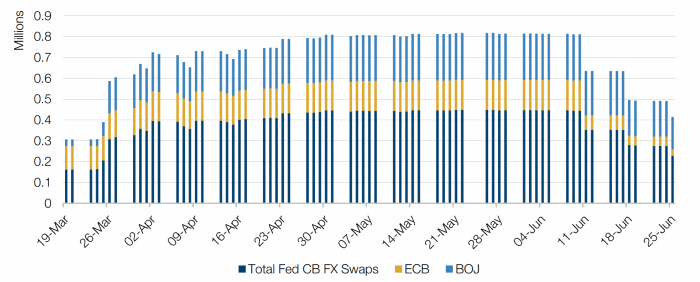
Source: Bloomberg, Federal Reserve; as of 25 June 2020
Figure 9. EUR/USD and JPY/USD Basis Swaps
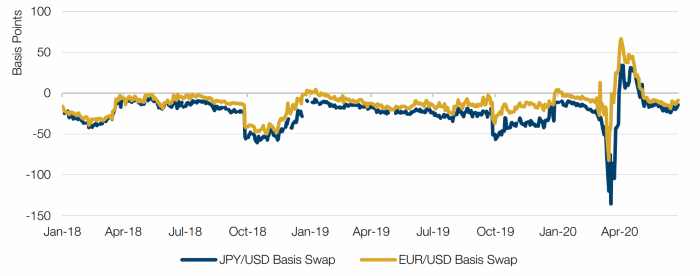
Source: Bloomberg; as of 26 June 2020.
With contribution from: Ed Cole (Man GLG, Managing Director – Equities).
1. The monetary base measures the overall total circulation of money in the US through various sources like the Fed, banks and consumers.
2. In the first week of June.
You are now leaving Man Group’s website
You are leaving Man Group’s website and entering a third-party website that is not controlled, maintained, or monitored by Man Group. Man Group is not responsible for the content or availability of the third-party website. By leaving Man Group’s website, you will be subject to the third-party website’s terms, policies and/or notices, including those related to privacy and security, as applicable.