Quote of the Week:
"HISTORIC JOBS NUMBERS! #MAGA."
US Jobs in Perspective
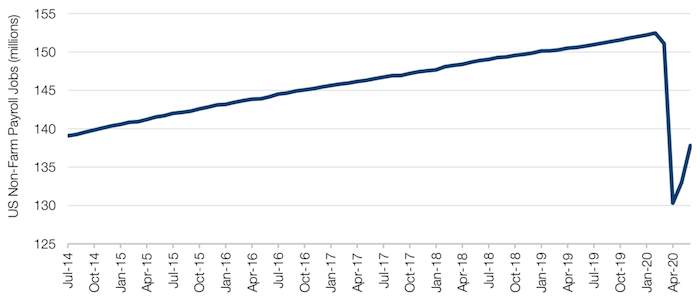
The US economy added 4.8 million jobs in June, the most since the Labor Department began keeping records in 1939, triggering a wave of bullish sentiment that the economic recovery from coronavirus is going strongly.
However, as Figure 1 shows, even a record month doesn’t quite compensate for the damage done to US employment since the onset of the coronacrisis. Taking June’s figures into account, US has now clawed back only 7.5 million of the 22 million jobs lost since March. Indeed, since the figures were compiled, states including California, Texas, Florida and New York moved to slow or reverse re-openings as coronavirus cases have surged.
The recovery still has some way to go yet.
Figure 1. US Adds 4.8 Million Jobs in June
Source: Bloomberg; as of 30 June 2020.
Behind the Rally: Opportunities in UK Equities?
When is a recovery an air-pocket? Possibly when it is confined to a very few large stocks.
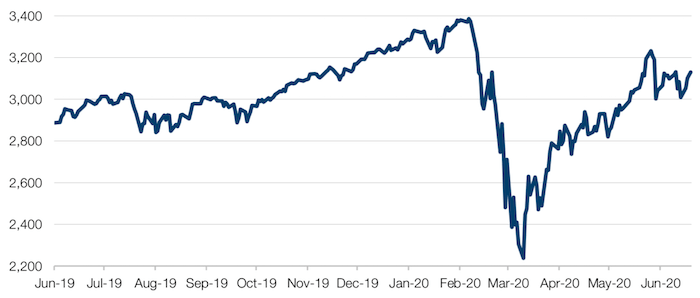
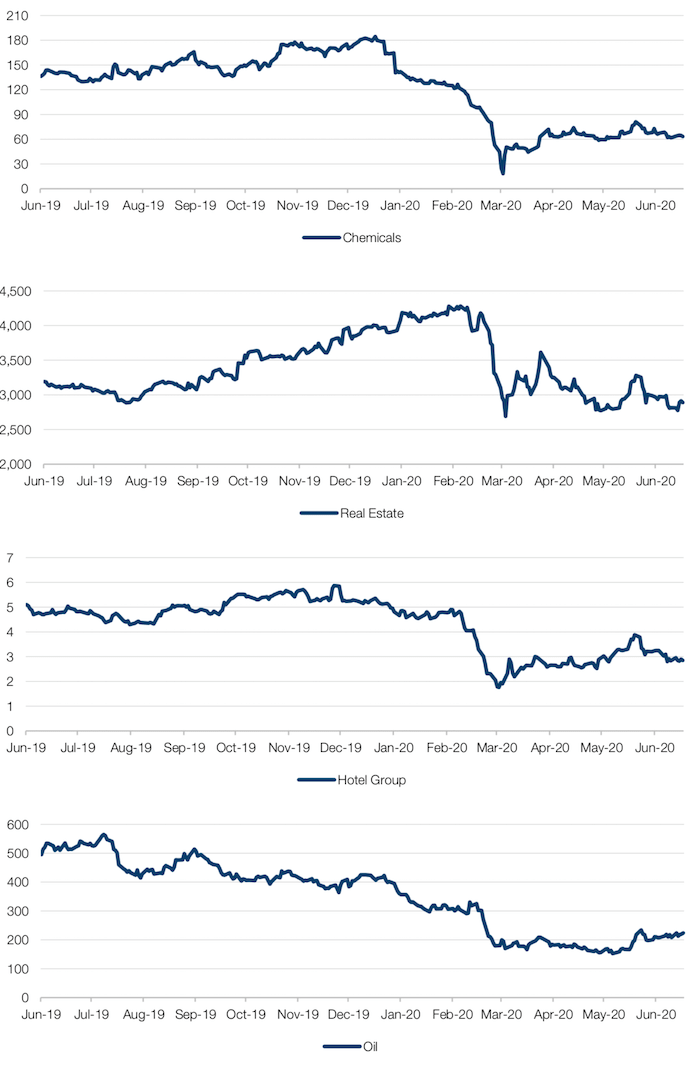
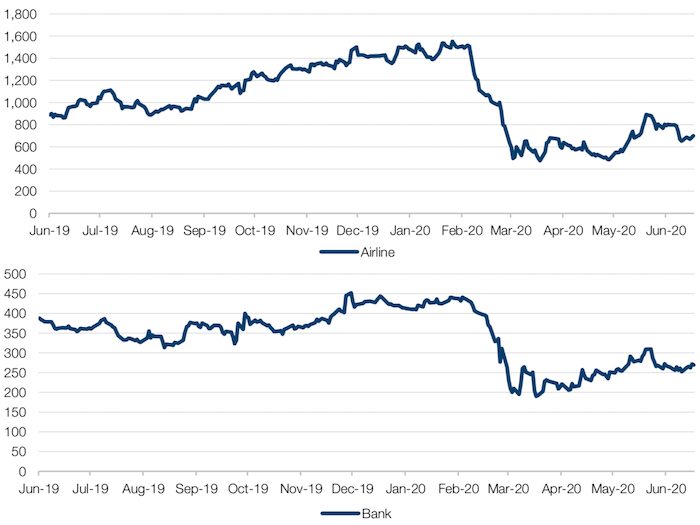
Despite the coronacrisis, the S&P500 Index is less than 10% off its all-time high (Figure 2). But this relief rally is not extending to other equity markets around the world at the same speed. Take the UK, for example. Figure 3 shows six UK stocks which could reasonably be defined as leaders within their sectors: chemicals, real estate, leisure, banking, oil and airlines. None of the stocks are trading anywhere near their 1-year highs.
We would make two observations based on this (limited) dataset, selected through the analysis of our discretionary teams. First, index-level data gives a misleading picture of the state of world equity markets, especially if too much focus is given to US indices, which are idiosyncratically tech heavy. UK investors are pricing in poorer returns than would be assumed from simply looking at the level of the S&P500, applying a stiff discount to those sectors worst affected by the coronacrisis. It is also worth noting that some of these UK stocks had entered the coronacrisis off the back of an already-weak 2019 – for instance, those in the oil industry had been suffering from a fall in the price of crude before the advent of the pandemic.
Secondly (and depending on your viewpoint of the shape of the recovery), some UK assets could be set for a rebound. The stocks in Figure 3 have, compared to their peers, stronger balances sheets, lower cost of capital and better returns than the rest of the sector. Ceteris paribus, in a variety of recovery and downturn scenarios, they are relatively likely to expand their share of the market at the expense of weaker competitors. In our view, with UK stocks trading at such steep discounts, it may have the opportunity to outperform significantly – the steep discount means that UK leaders require less positive news to justify an expanded multiple compared with more expensive stocks and indices.
Figure 2. S&P500 Index
Source: Bloomberg; as of 2 July 2020.
Figure 3. Six UK Sector Leaders
Source: Bloomberg; as of 3 July 2020.
The Fragile Oil Recovery
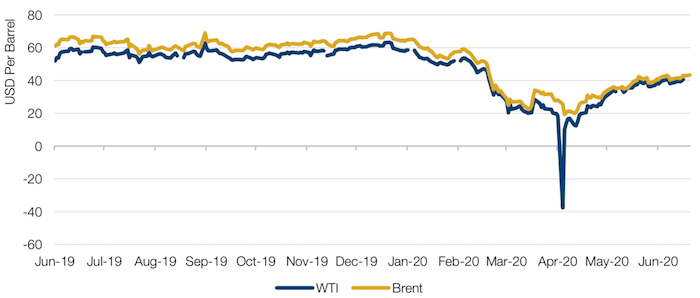
Oil prices have more than doubled since lows in April (Figure 4).
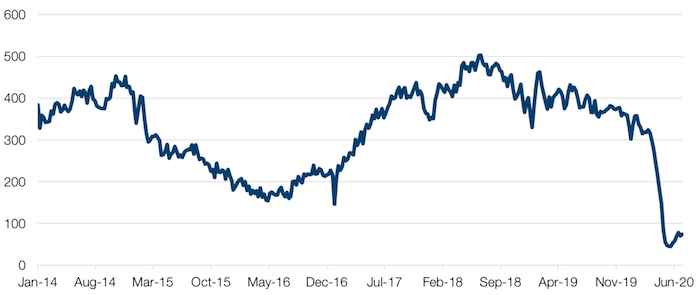
This has been primarily driven by a reduction in supply, most visible in marginal cost onshore US production in the frac spread (which measures the number of equipment sets used in the hydraulic fracturing process for unconventional onshore oil), which has collapsed (Figure 5).
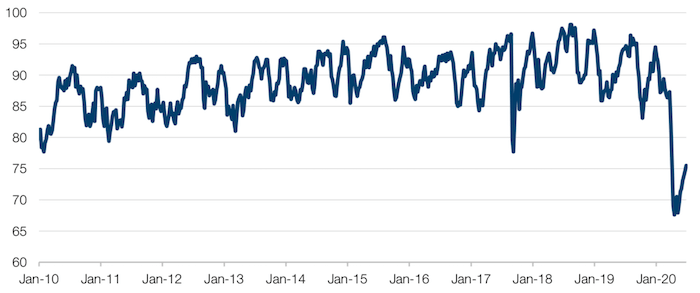
On the demand side, there are two visible drivers – a recovery in US refinery capacity utilisation, though that remains well below pre-Covid levels (Figure 6), and increasing demand from China, which imported about 12 million barrels a day in May, with the figure tracking about 14 million barrels a day in June (equivalent to a year-on-year increase of about 50%).1
However, in the event of any slowing of the recovery in economic activity, or resurgence of risk aversion, crude may be particularly vulnerable for a couple of reasons.
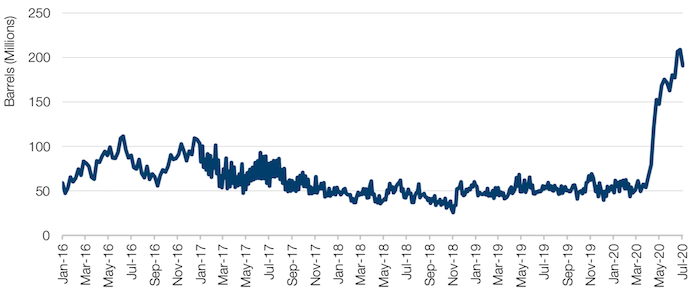
First, we believe that the recovery in Chinese demand may have been somewhat inflated: refinery utilisation, where visible, is running at record high levels, despite demand for refined products (particularly jet fuel) remaining depressed, which suggests that the high refinery throughput may have more to do with getting industrial production recovering rather than very strong end-demand. Secondly, oil in floating storage is at record highs (Figure 7), suggesting that the market remains imbalanced.
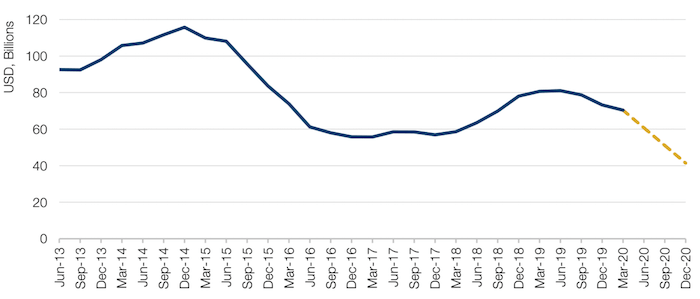
In the longer term, when crude demand has normalised, the outlook is a bit more constructive: estimates for US oil exploration and production capital expenditure have come down materially, from USD80 billion for the industry group in the fourth quarter of 2019, to USD40 billion now (Figure 8). And it seems reasonable that after lean years, the focus will be more on balance sheet repair and dividends, rather than exploration capex.
Figure 4. WTI and Brent Crude Spot Price
Source: Bloomberg; as of 6 July 2020
Figure 5. Active US Fracking Production
Source: Bloomberg; as of 2 July 2020.
Figure 6. US Refinery Capacity Utilisation
Source: Bloomberg; as of 26 June 2020.
Figure 7. Oil Floating Storage
Source: Bloomberg; as of 3 July 2020.
Figure 8. US Energy Company Projected Capex
Source: Man GLG; as of 30 June 2020.
Short-Term Gain, Long-Term Pain?
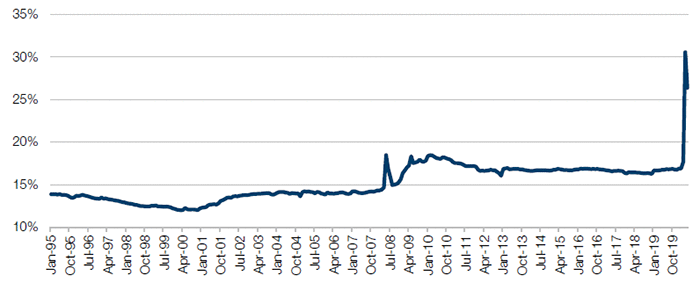
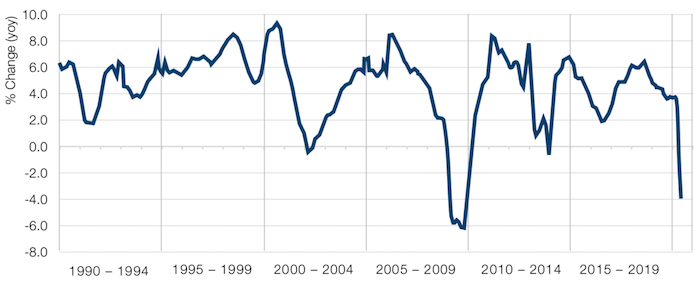
Earlier in June, we wrote about how the coronacrisis has resulted in Americans hoarding more money than ever, partly driven by a surge in income. In some senses this defied economic logic – how could incomes go up in a recession? However, this is explained by the fact that US government subsidies as a percentage of US personal incomes stood at 26% in May, hovering near its all-time highs after (Figure 9). Indeed, after excluding the government subsidies, US personal incomes actually declined 4% year-over-year in May (Figure 10).
We believe that with unemployment levels still elevated and with selected US states going into a second phase of lockdown, Congress will not let these subsidies – which are due to lapse at the end of July – expire entirely. Any news on the extension of these subsidies is likely to be taken as a bullish sign by the market. However, these subsidies will have to roll off in the longer term. If this happens at a time when the economy has not recovered to a normal level, where unemployment is still elevated, there is a risk to discretionary consumption, which in some categories has clearly received an artificial boost.
Figure 9. US Government Subsidies as % of US Personal Incomes
Source: Bloomberg; as of 31 May 2020.
Figure 10. US Personal Incomes Excluding Government Subsidies
US Personal Incomes Excluding Government Subsidies
With contribution from: Russell Korgaonkar (Man AHL – Director of Investment Strategies), Jack Barrat (Man GLG, Portfolio Manager) and Ed Cole (Man GLG, Managing Director – Equities).
1. Source: Bloomberg.
You are now leaving Man Group’s website
You are leaving Man Group’s website and entering a third-party website that is not controlled, maintained, or monitored by Man Group. Man Group is not responsible for the content or availability of the third-party website. By leaving Man Group’s website, you will be subject to the third-party website’s terms, policies and/or notices, including those related to privacy and security, as applicable.