Quote of the Week:
“ I don’t think my secretary will be sending Dominic Cummings any cakes to say thank you."
The Micawber Divergence: Green Shoots in the US?
“Annual income twenty pounds, annual expenditure nineteen nineteen and six, result happiness. Annual income twenty pounds, annual expenditure twenty pounds ought and six, result misery.”
- Wilkins Micawber, Charles Dickens
The coronacrisis has resulted in Americans hoarding more money than ever: the personal savings rate hit a historic 33% in April, the highest since the 1960s (Figure 1). This was driven by Americans’ incomes surging by a staggering 10.5% during the month while US consumer spending plunged by a record 13.6% (Figure 2).
Separately, real-time weekly credit card data from JPMorgan Chase indicates that consumer spending, at least on tick, is slowly creeping up again in the US (Figure 3). Specifically, spending by the Millenials and Gen Z – which is potentially the demographic that has more propensity to spend – has started to tick upwards.
With the US consumer accounting for more than two-thirds of the economy, we believe that this combination of cash-on-hand and the normalisation of spending means that when businesses start to open up again, there is a potential that we could be surprised on the upside.
Figure 1. US Personal Savings as a Percentage of Disposable Personal Income
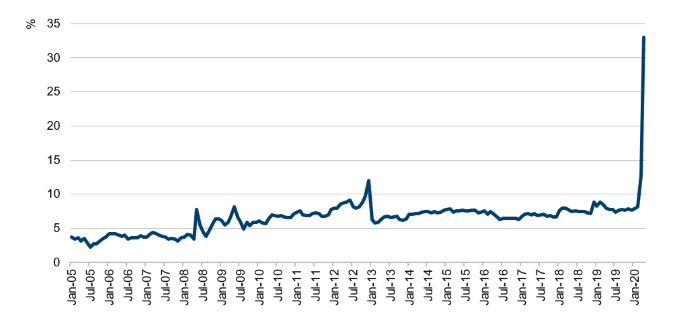
Source: Bloomberg; as of 5 June 2020.
Figure 2. US Personal Incomes and Consumption Expenditures – MoM Percentage Change
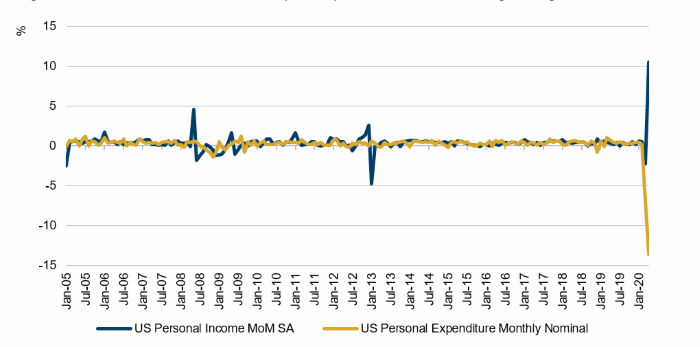
Source: Bloomberg; as of 5 June 2020.
Figure 3. Consumer Credit Card Spending by Generation
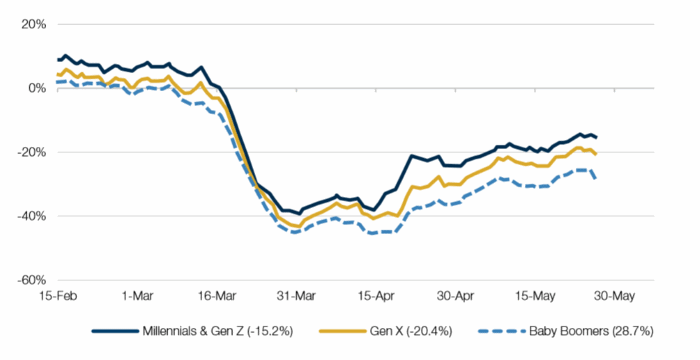
Source: JPMorgan Chase; as of 23 May 2020.
A Speeding Bear and a Charging Bull
First came the plunge and then came the climb.
Peak-to-trough, the S&P500 Index fell 33% in 33 days, with the Nasdaq index falling 30% over 30 days. As we have previously written, this represented the fastest selloff in US equity market history, although not the deepest (Figure 4).
Since then, however, there has been a significant bounce back. The Nasdaq briefly reached a record high on 5 June, with the S&P500 down only 5.68% since the peak, making the subsequent bull market almost as fast as the fall.
It is not just the size and speed of the moves that make this equity recovery deeply odd. Whilst non-farm payrolls surprised to the upside in the US last week, with roughly 2.5 million new jobs created, the wider economic picture is still gloomy: the 2.5 million jobs were more than outweighed by the 12.6 million new US jobless claims over the last month.
How is that equities are surging when the wider economy is crumbling? Our only theory is that the winners from the coronacrisis are strongly represented in some equity indices, and the losers are not. Lockdown, by and large, has been good for the tech firms which make up so much of the market cap of the two indices. By contrast, unlisted companies such as SMEs are much more likely to have been forced to close by lockdown, and employ a much larger slice of the American workforce.
Figure 4. S&P 500 Versus Nasdaq
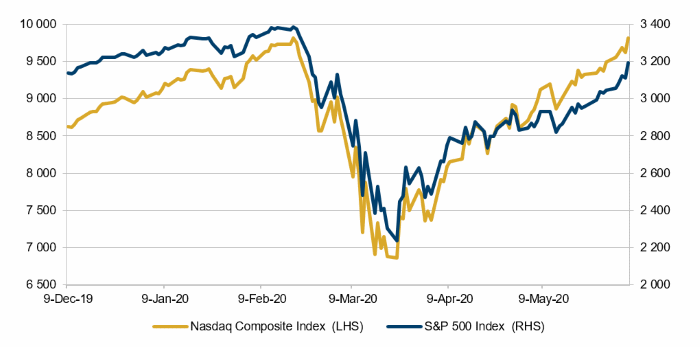
Source: Bloomberg; as of 8 June 2020.
With contribution from: Ed Cole (Man GLG, Managing Director – Equities) and Matthew Sargaison (Man AHL, CIO and co-CEO).
You are now leaving Man Group’s website
You are leaving Man Group’s website and entering a third-party website that is not controlled, maintained, or monitored by Man Group. Man Group is not responsible for the content or availability of the third-party website. By leaving Man Group’s website, you will be subject to the third-party website’s terms, policies and/or notices, including those related to privacy and security, as applicable.