Introduction
In our recent note “Trend-Following: What’s Not To Like?”, our key point was that trend-following and equities returned about the same in the long term, yet got there by very different routes: trend-following tended to do well when equities didn’t (tech bubble burst 2000-3, GFC 2008-9), and equities performed well during the ‘CTA winter’ in the aftermath of the GFC. Our suggestion was that trend-following was highly complementary to traditional investments such as equities and the ubiquitous 60/40.
If It Moves, Monetise It
The key concept here is monetisation; using trend-following’s observed ‘crisis alpha’ characteristic, meaning its ability to perform well during crisis periods for traditional portfolios, to facilitate greater exposure in the good times.
It is always fascinating to read feedback. Perhaps it should not have been surprising that the negatives were in focus. Yes, the CTA winter did last 10 years, and performance was flat. We stated this. But we also pointed out that equities lost half their value twice since 2000.
Let us take this criticism on the chin and use the opportunity to flesh out a point we alluded to in our note, namely how we can monetise trend-following’s negative correlation to equities when risk assets turn south. Spoiler alert: we can allocate to a trend-following strategy alongside a traditional portfolio, improve overall return and risk characteristics and not materially underperform in the ‘CTA winter’ of 2009-19. Sound too good to be true? Read on.
The key concept here is monetisation; using trend-following’s observed ‘crisis alpha’ characteristic, meaning its ability to perform well during crisis periods for traditional portfolios, to facilitate greater exposure in the good times. If we’re less concerned about a fall, we tend to run, ski, snowboard, climb – you name it – faster.
In Figure 1, note how a portfolio of 50/50 stocks/trend-following performs just as well as a pure equities portfolio (around 8%), yet has significantly lower volatility (10% versus 14%), and around one third the drawdown (16% versus 50%). To coin a phrase, what’s not to like about that? Well, we could be picky and say that yes, risk-adjusted returns are higher in the blended portfolio – the Sharpe ratio is 0.52 versus 0.30 for World Stocks – but you can’t eat Sharpe ratio. Returns are what really matters to end investors, such as those from pension funds. Wouldn’t it be nice if this improvement in risk could be monetised?
Figure 1. World Stocks, Trend-Following (Barclay BTOP50), and 50/50 Blend Since Inception of BTOP50 Index in 1986. Account Curve (Top), Drawdown (Bottom)
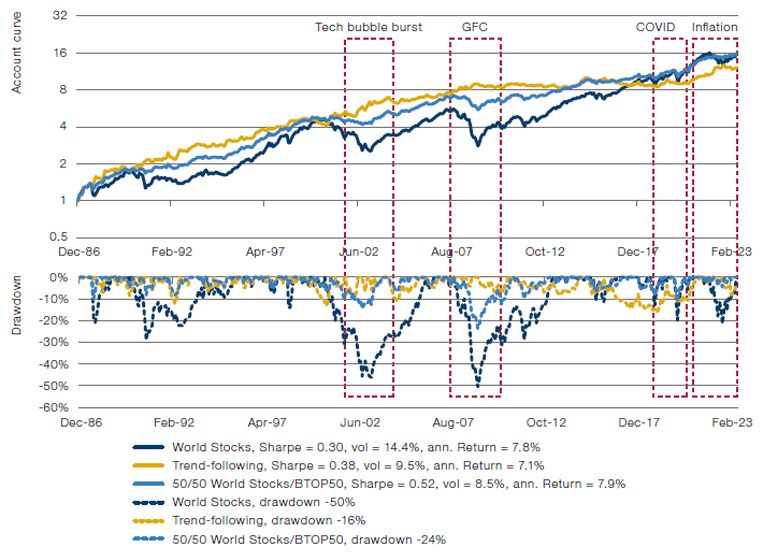
World stocks represented by MSCI World Net Total Return Index hedged to USD. Trend-following represented by Barclay BTOP50 Index. Source: Man Group database, Bloomberg, BarclayHedge. Date Range 31 December 1986 to 30 June 2023. Please see the important information linked at the end of this document for additional information on hypothetical results.
We also have the CTA winter problem. Between 2009 and 2019, trend-following strategies were broadly flat, returning -0.4% per annum compared with World Stocks at +10.3% (Table 1). It is unsurprising that any blend of trend-following with World Stocks underperforms.
Table 1. Statistics for World Stocks, Trend-Following (Barclay BTOP50), 50/50 Blend, and 2x Levered 50/50 Blend
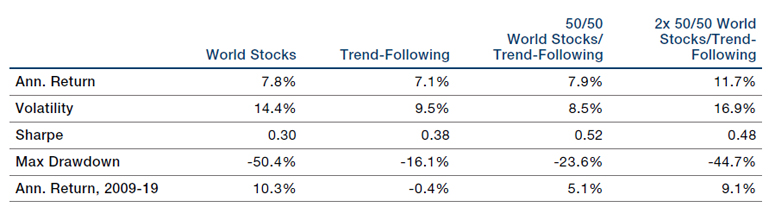
Source: Man Group database, Bloomberg, BarclayHedge. Date range: 31 December 1986-30 June 2023. Please see the important information linked at the end of this document for additional information on hypothetical results.
In summary, although our blended portfolio looks better than World Stocks in pure statistical terms, we have two problems. First, returns are the same, and second, it underperforms a World Stocks portfolio for 10 years starting in 2009.
Switching Up a Gear
What we have done, through this additional gearing, is monetise trend-following’s defensive properties, thereby solving our two problems.
In the final column of Table 1 we illustrate what happens when we gear up our blended portfolio by a factor of two, funding the additional exposure – 100% in this case – at the prevailing cash rate. Compared to our original World Stocks portfolio, in the first column, we notice that for our geared blended portfolio in the final column:
1. Overall returns are significantly better; 12% versus 8% per annum
2. Returns during the CTA winter 2009-19 are about the same, around 10% per annum (our critics are happy!)
3. Volatility and drawdowns are about the same
Eureka! What we have done, through this additional gearing, is monetise trend-following’s defensive properties, thereby solving our two problems. We can take more exposure in the good times because we know that the downside is taken care of through trend-following’s crisis alpha properties. We illustrate the starting World Stocks portfolio and final twice-geared blended portfolio in Figure 2.
Figure 2. World Stocks and 2x Levered 50/50 Blend of World Stocks and Trend-Following (BTOP50). Account Curve (Top), Drawdown (Bottom)
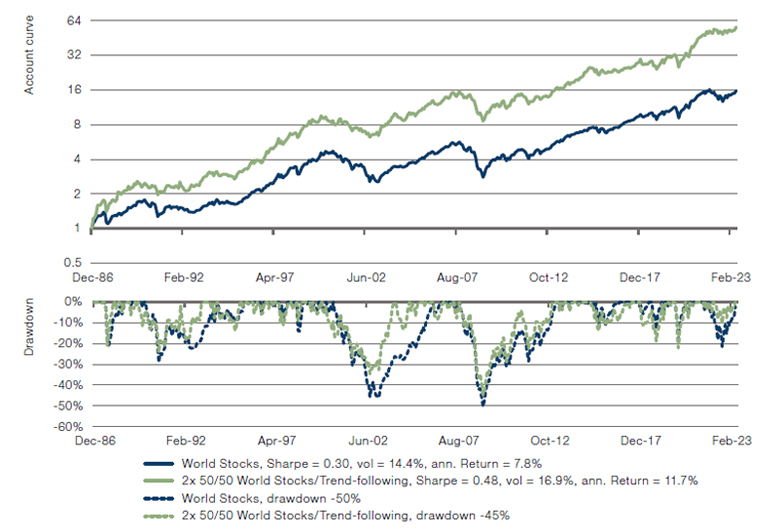
World Stocks represented by MSCI World Net Total Return Index hedged to USD. Trend-following represented by Barclay BTOP50 Index. Source: Man Group database, Bloomberg, BarclayHedge. Date range: 31 December 1986-30 June 2023. Please see the important information linked at the end of this document for additional information on hypothetical results.
Some Parting Thoughts
Leverage is often associated with additional risk and followed by a gnashing of teeth and a sharp intake of breath. In this case, the leverage is afforded by the diversification offered by the trend-following strategy.
Our reader may have picked up on our frustration at some of the comments on our original “Trend-Following: What’s Not to Like?” piece, and indeed this was the motivation for writing this article. By concentrating on the CTA winter, in a sense our critics were saying, “In one of the best periods for our strategy (stocks), your strategy (trend-following) does badly”. It is hard to argue with this kind of logic. Defining the CTA winter as being the 10 years from 1 January 2009, as we do in this article, performance of World Stocks is in the 83rd percentile of rolling 10-year returns, while trend-following is in its 1st percentile. That this 1st percentile corresponds only to an annualised loss of 0.4% is remarkable in itself, in our view. What we have suggested in previous articles in this series is that this diversification should be celebrated. In this article we have shown how this diversification can be monetised.
Gearing, or leverage, is the key to this monetisation, and indeed this is a well-trodden journey along the Capital Markets Line, maximising return for a given level of risk1. Leverage is often associated with additional risk and followed by a gnashing of teeth and a sharp intake of breath. In this case, the leverage is afforded by the diversification offered by the trend-following strategy. Because of trend-following’s low correlation to stocks on average, and negative correlation in crisis periods, the twice-geared portfolio has very similar risk characteristics to the original World Stocks portfolio, namely volatility and maximum drawdown. We refer our reader to our article “Leverage Does Not Equal Risk” for a more in-depth discussion.
But we can do better still. First, trend-following can be tuned to perform better in crisis periods, as we discussed in “The Need For Speed In Trend-Following Strategies”. Second, there are various ways of representing both the traditional portfolio and trend-following strategies in a cash-efficient manner, through implementation in the form of futures. In fact it is possible to gear portfolios without additional cash. In short, you can potentially implement this strategy without needing to raise another dollar.
We will explore the benefits of cash efficiency in our next note.
Bibliography
Robertson, G. (2023), “Trend-Following: What’s Not to Like?”, Man Institute, Available at: https://www.man.com/maninstitute/trend-following-what-not-to-like
Abou Zeid, T (2022). “Leverage Does Not Equal Risk”, Man Institute, Available at: https://www.man.com/maninstitute/leverage-equal-risk
Mackic, A. (2023), “The Need for Speed in Trend-Following Strategies”, Available at: https://www.man.com/maninstitute/need-for-speed-trend-following
1. https://www.investopedia.com/terms/c/cml.asp#toc-what-is-the-capital-market-line-cml
You are now leaving Man Group’s website
You are leaving Man Group’s website and entering a third-party website that is not controlled, maintained, or monitored by Man Group. Man Group is not responsible for the content or availability of the third-party website. By leaving Man Group’s website, you will be subject to the third-party website’s terms, policies and/or notices, including those related to privacy and security, as applicable.