Introduction
Those in winter climates may appreciate the notion of a hypothetical perfectly efficient home-heating system. This purely theoretical system maintains a constant temperature in the house. To do so, it draws more power when the weather outside is colder.
Devoid of context and shown only the underlying data from this dynamic, what would an observer conclude? Power consumption and the external temperature are inversely correlated. But because the thermostat keeps the internal temperature constant, there appears to be no statistical relationship between it and either of the other two factors. The only causation seems to be that higher power use lowers the temperature outside, or vice versa, so the homeowner would be well advised to switch off the heating system that has no effect on their warmth.
Extreme temperatures in both directions will place greater demands on global energy systems.
Such a schematic, derived from what Milton Friedman called ‘the Fed’s Thermostat’, illustrates the complexities of correlation, causation and feedback loops in energy and climate models.1 For not only is the climate responsive to our energy systems (not least through greenhouse-gas emissions), but our energy systems are responsive to the climate too.
This is why we cannot take any intuitive comfort from the possibility that a warmer world will consume less fuel for heating. Rather, it is more likely that extreme temperatures in both directions will place greater demands on global energy systems, exacerbating the problem in a vicious cycle.
These concerns are not simply abstract, and nor are they distant in time or limited to regions traditionally associated with great demand for internal climate control like air conditioning. This past summer, a heatwave in China shut down factories because of the expected cooling needed to keep citizens safe.2 India suffered blackouts lasting up to eight hours as early in the year as April due in large part to high temperatures.3 Economic development does not reliably protect against these risks either: September brought a warning from California’s state power-grid operator that the historic heat wave and all-time high electricity demand had pushed the system to the brink.4
Winter, of course, poses a different but related set of challenges. Europe is still counting on a milder end to the winter to keep natural-gas prices down in the face of geopolitical conflict and inflation, with France’s energy regulator explaining the need to reduce energy consumption or face blackouts.5 An extreme cold snap in 2021 brought a crisis to the Texan electricity grid, resulting in hundreds of deaths and long-term economic damage.6
Even with a resolution of the current supply constraints in gas markets, and abatement of the issues that have depressed various forms of renewable generation this year, we expect a warmer climate to place greater stress on energy systems. The International Energy Agency has forecast that, on current trends, the energy demand from air conditioners will more than triple by 2050 – which alone would be equivalent to China’s electricity demand.7 More anecdotally, in historically mild and non-air-conditioned Britain, a major supermarket reported a 2,420% increase in week-on-week sales of airconditioning units this past summer.8
Why Investors Should Care and What We Can Do
If surging demand for cooling causes blackouts, or significantly higher electricity costs, energy-intensive businesses could suffer.
As asset managers, the future of energy demand matters to us because energy is an important operational cost for many companies. Generally, to produce more, a company will need greater energy. And so as climate change affects our energy systems, we can expect that there can be large potential changes to company production. If surging demand for cooling causes blackouts, or significantly higher electricity costs, energy-intensive businesses could suffer.
To determine the likely impact of climate change on energy demand for public securities, we project future climate scenarios with Man’s AI Climate Change Projection System (MACCS) and data with over 3.5 million facility locations across the globe.
MACCS is a proprietary physical climate model that applies machine learning to the climate models produced by academic institutions for the climate model intercomparison project 6 (CMIP6) to achieve high-resolution data on possible future climates.
We transform the temperature data taken from using academic literature (such as Cian et al. 2019), and Figure 1 displays the schematic relationship between temperature and energy consumption for different building types. As the climate goes from cold to warm, there is diminishing demand for heating. But on the other hand, as the climate goes from warm to hot, we see an increasing energy demand resulting from cooling and other climatic controls.
Figure 1. Schematic Relationship Between Temperature and Energy Consumption for Different Building Types
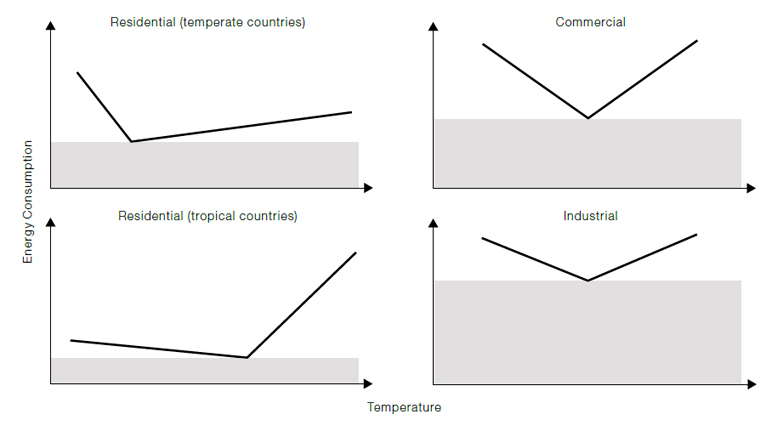
Source: Schematic illustration, derived from work by Enrica De Cian & Ian Sue Wing (De Cian, E., Sue Wing, I. Global Energy Consumption in a Warming Climate. Environ Resource Econ 72, 365–410 (2019).
We also see that different building types have different sensitivities. For example, energy demand in commercial buildings has a higher sensitivity to the climate than industrial buildings. This is generally true for companies where human capital is important: the need to keep office spaces cooled or heated grows with an expanding workforce.
So how would we apply this process to an individual company? The first step is to locate the company’s buildings. To do so, we use third-party data on facilities to identify the company’s geolocation. Figure 2, for example, depicts the facilities of a US industrials company.
Figure 2. Facilities of a US Industrials Company
Problems loading this infographic? - Please click here
Source: Man Numeric, December 2022.
At this point, we know where the company operates – but we do not know what each facility does. Even though this is an industrial company, each location may be an office, a distribution centre, or a manufacturing facility, among other building-use types. As shown in Figure 1, it’s important to know the building type to assess how climate change will impact its energy demand.
To determine each location’s use type, we deploy open-source data and proprietary machine-learning methods. First, we look up each facility programmatically on Open Street Map, an opensource geospatial database that developers can use to build mapping software. We then use all the results found to build a random-forest machine-learning model to impute the locations missing in Open Street Map.
Now, with Open Street Map and the random-forest model, we have a best guess of the use type for each facility. We then use MACCS to project the future climate-induced changes to energy demand at every facility given its use type. For instance, Figure 3 shows a stylised example of an office facility; we assume here the facility is currently in a temperate location with 10 hot days a year and the earth’s temperature continues to rise.
Figure 3. Projected Energy Demand at an Illustrative Office Facility
Problems loading this infographic? - Please click here
Source: Man Numeric, December 2022.
Here we see that the number of hot days at the location, defined as the number of days above 27.5 C within a year, increases steadily from 10 to 90. This results in an increase in energy demand of 43% at the end of the century.
For a more useful investment insight, we can next discount the future impacts. We do this because the value of the impacts out at the end of the century is far less concerning, for markets, than the impacts over the next decade.
We can then repeat these steps for each of the company’s facilities’ electricity demand, gas demand, and petroleum demand. Each one of these fuel types has its own sensitivity to the climate, so each fuel type has a sensitivity coefficient for the number of hot days and the number of cold days. This coefficient is also dependent on whether a given facility is in a temperate or tropical region. In total, for each facility, we calculate its aggregate change in energy demand as the sum of the changes in electricity, gas, and oil for both the changes in cold and hot days.9
After the future impacts are discounted and summed across fuel types, we aggregate the impacts across all facilities to determine a final total climate-induced energy-demand score for the company.
Conclusion
The climate is changing and companies are already seeing the impact of extreme heat on their bottom line.
We expect these values to yield important investment insights in two distinct ways. The first is that the climate is changing and companies are already seeing the impact of extreme heat on their bottom line. For example, many companies requiring refrigeration in Europe this past summer had “overworking” refrigerators that broke due to unprecedented heat, resulting in business interruption and increased operational expenses.
The second is that financial regulatory bodies such as the SEC and ECB are beginning to require companies to disclose such climate-related risks. We believe it is critical to be a first mover in accounting for these climate-related risks in our investment decision-making process.
As is clear from Friedman’s hypothetical thermostat, looking at datapoints without a holistic understanding of the dynamics involved can lead to incorrect conclusions. This paper has set out just one way in which we try to quantify the potential impact of climate change on securities. Doing so is valuable in its own right, but as importantly contributes to building a fuller picture of portfolio risks.
1. Milton Friedman, ‘The Fed’s Thermostat’, Wall Street Journal, 19 August 2003; Nick Rowe, professor of economics at Carleton University, expanded the metaphor in this way.
2. Financial Times, ‘China intensifies measures to deal with heatwave and power shortages’, 22 August 2022.
3. Bloomberg, ‘Eight-Hour Blackouts Hit India After Hottest March on Record’, 21 April 2022.
4. California Independent System Operator, Energy Emergency Alert 2, 6 September 2022.
5. Bloomberg, ‘French Regulator Demands Lower Energy Use to Avoid Blackouts’, 9 November 2022.
6. Federal Energy Regulatory Commission, ‘The February 2021 Cold Weather Outages in Texas and the South Central United States’, 16 November 2021.
7. International Energy Agency, ‘The Future of Cooling’, 2018.
8. Reuters, ‘Fans, hoses and air con - heatwave-hit Britons seek relief’, 18 July 2022.
9. A full table of the coefficients used is available from the paper by Enrica De Cian and Ian Sue Wing.
You are now leaving Man Group’s website
You are leaving Man Group’s website and entering a third-party website that is not controlled, maintained, or monitored by Man Group. Man Group is not responsible for the content or availability of the third-party website. By leaving Man Group’s website, you will be subject to the third-party website’s terms, policies and/or notices, including those related to privacy and security, as applicable.