Introduction
Average years are quite rare. Equities rise high single digits in an average year.1 But an actual average year is surprisingly rare: equity markets either rise by well over 10%, or fall, a lot of the time – see Figure 1. On balance, we would choose the more bearish of these two scenarios for 2022, and we go into the year with quite full exposures and heightened awareness. Inflation holds the key, in our view.
Problems loading this infographic? - Please click here
Strong Triple Headwinds
Let’s start with the basics of changes at the margin that so often drive markets: strong headwinds are provided by high starting valuations + less policy support + less growth in 2022.
Let’s start with the basics of changes at the margin that so often drive markets: strong headwinds are provided by high starting valuations + less policy support + less growth in 2022.
First, the Shiller price-to-earnings (‘PE’) ratio for US equities is now 39x, only surpassed once in the last 140 years; while nominal US 10-year rates at 1.5% are one of the richest ever, too. These valuations are highly unattractive in a historical context, predicated on rates staying ultra-low.
Second, central banks are ending quantitative easing and preparing rate hikes, as the period of extraordinary stimulus starts to normalise. A key risk is that they need to scramble to get ahead of the inflation curve again.
Third, growth will naturally slow down in 2022, from incredibly high levels, as illustrated by our models (Figure 2).2
Figure 2. Growth Will Be Lower Next Year – DNA US Leading Activity Indicator
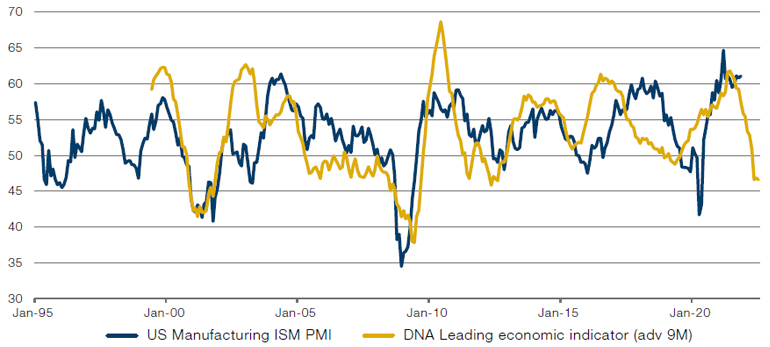
Source: Bloomberg, Man Solutions; as of 30 September 2021.
Inputs are as follows: ISM Manufacturing Prices Paid (advanced 15 months, lower is better), 12-month change in global government yields (advanced 18 months, lower is better), 12-month change in capacity utilisation (advanced 14 months, lower is better), 3MMA of 12-month performance of MSCI Asia ex Japan (advanced 15 months, lower is better), 12-month out/ under performance of Consumer Discretionary over Homebuilders (advanced 21 months, lower is better), 12-month out/under performance of late cycle companies over early cycle companies (advanced 12 months, lower is better), USD 2-year swap spread (advanced nine months, lower is better) and 12-month change in US import prices (advanced 12 months, lower is better).
But Is it the End of the Growth Cycle?
Having said that, it is recessions that create the largest ructions in markets, and there is no recession in sight, according to our models. Policy, while less supportive, will not be restrictive yet – witness, for instance, the positive slope in the yield curve – and growth is likely to be above trend still. Consensus 2022 real GDP is currently a very comfortable 3.9% in the US, 4.2% in the Eurozone, 4.9% in the UK, 2.8% in Japan and 5.3% in China, according to Bloomberg – far from the stall speed that could easily tip over into recession territory.3 Growth can also be underpinned by a capex boom – with, for instance, Evercore ISI capital goods survey on a multi-decade high. Empirical Research estimates that 2021 S&P 500 EPS will settle at USD220, versus prior expectations of USD173, while 2022 could end up at USD240, beating consensus again.
In our judgment, inflation will hold the key to markets in 2022.
In our judgment, inflation will hold the key to markets in 2022.
It is official, now – we are in an inflation period since March 2021. According to our definition from The Best Strategies for Inflationary Times, we have entered the ninth inflationary episode in the US since 1926 (Figure 3). This period will end when the final inflation peak is reached, before a fall in the headline inflation number of more than half. The average length of the eight previous episodes in our sample across three countries is 25 months, much longer than the current nine months.
Figure 3. We Are Officially in the 9th US Inflationary Episode Since 1926
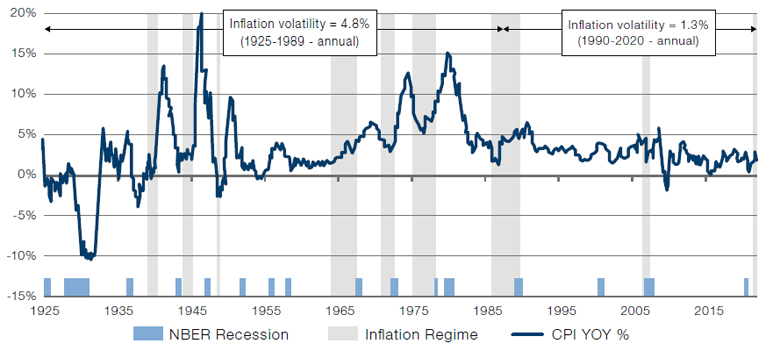
Source: Shiller PE dataset, NBER; as of June 2020.
Note: Graph is CPI YoY, with blue shaded zones being those regimes as quantitatively defined in The Best Strategies for Inflationary Times.
So far, compared to usual, equities have done much better, and gold much worse.
So far, compared to usual, equities have done much better, and gold much worse. Performance in this episode has followed the norm in many ways: commodities, trend-following and equity momentum long/short have been good, while fixed income has been bad. The outliers so far have been gold – much worse than usual, perhaps because crypto has provided new and fierce competition; and equities – much better than usual (Figure 4).
Figure 4. Performance Comparisons With Past Inflations – Gold Worse, Equities Better
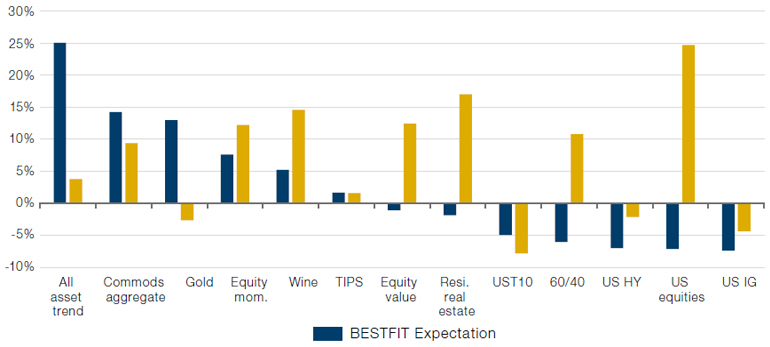
Source: Equities are the S&P 500 using Professor Shiller’s data. Bonds are UST10 from GFD. 60/40 is the monthly rebalanced 60% equity, 40% bonds portfolio. Commodities are proxied by an equal weight portfolio of all futures contracts as they appear through history. From 1877 to 1946, this is based off work done by AQR. From 1946, we use returns data from the Man AHL database. Sectors are the based off the 12 Fama-French industry portfolios. Similarly, styles are the Fama-French portfolios (SMB, HML, RMW, CMA and Mom., respectively), apart from Quality and Low Beta which are AQR (QMJ and BAB). Duration returns from GFD. TIPS prior to 1997 based off a backcast by William Marshall at Goldman Sachs, otherwise Bloomberg. Credit portfolios constructed by the DNA team from data provided by Morgan Stanley. Wine returns from Credit Suisse to 2001, and then the Liv-Ex 100 Fine Wine benchmark. Residential RE is based on the Case-Shiller index. All returns are total return. Current inflationary period is measured from March 2021 to present (inclusive). The current period is confirmed as an inflationary period as per the definition in the academic paper, the end of the regime (determined by the peak rate of inflation) is yet to be determined. All returns above for this regime to end October (the last inflation print), with the exceptions of All asset trend, and wine, which are to end September due to data availability issues.
Equities have historically done well at the start of inflations. We have found that commodities do well and bonds badly in rising inflation, irrespective of whether inflation is low or high to start with. Equities, however, have performed well at the start of inflationary periods, as moving away from a deflationary threat is beneficial to earnings and equity multiples. It is in the latter stages that the disruptive effect of higher and more volatile inflation hurts margins, the business climate and equity multiples.
A Dangerous Turning Point for Equities
We could be on the cusp of a dangerous turning point for equities right now.
We could be on the cusp of a dangerous turning point for equities right now. Regular readers of our musings will know that we hold the wisdom of stock-bond correlations in high regard. In the absence of an inflation threat, price movements of stocks and bonds have been negatively correlated for four decades now, to the benefit of asset allocators. A change in this correlation structure would ring our alarm bell. Figure 5 shows that, based on 3-year averages, a core CPI reading of more than 2.5% has coincided with positive stock-bond correlations historically; and that the 1-year reading on that chart signals that the current market structure may well be about to tip over into a much more dangerous one where stocks and bonds sell off simultaneously.
Figure 5. Potential Danger! On the Cusp of a New Correlation Regime
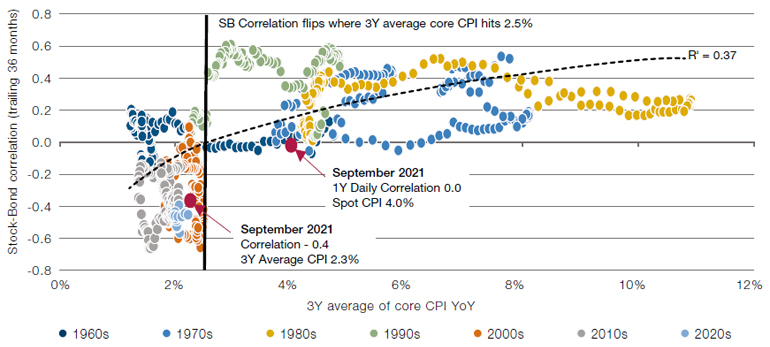
Source: Bloomberg, Man Solutions; as of 30 September 2021.
And clearly, inflationary pressures are strong. Labour markets across the world are extremely tight. In the US, there are over 10 million vacancies and less than 7 million unemployed. Wage inflation is already high, and may increase further as the unemployment rate falls further, perhaps as low as sub-3%, according to Evercore ISI. Longer-term pressures remain inflationary, especially through policies to address climate change and inequality, while fiscal spending is high and central banks allow inflation overshoots. Wages are rising fast, and policy rates are lagging inflation, much more than before, intentionally, thus exacerbating the inflation problem (Figure 6). These, to us, are the perfect ingredients to increase inflation expectations permanently.
Figure 6. Wages Accelerating, Rates Not Yet
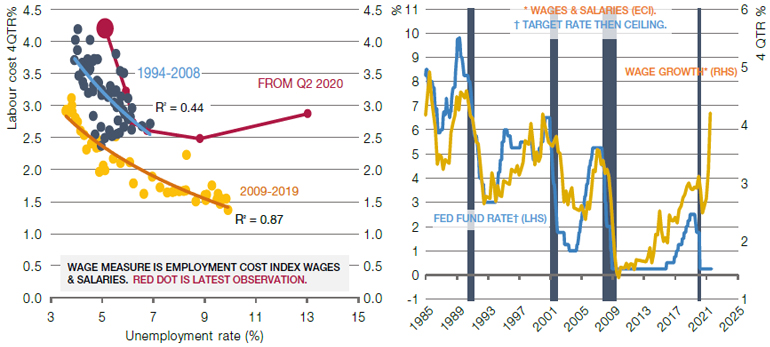
Source: Minack Advisors; as of June 2020.
Inflation to Peak Due to Base Effects, Easing of Supply Chain Bottlenecks
Superficial easing of inflation could be very bullish for traditional assets, temporarily.
Based on headline inflation alone, we expect inflation to ease from the current 7% in the first half of 2022.4 As supply chains ease, base effects kick in and rises in used car sales prices et al. moderate, headline inflation will ease (Figure 7). This is not to say inflationary pressures are over, as previously mentioned; indeed, there are clear signs of persistent inflation in services, wages and housing. But still, we believe this superficial easing of inflation could be very bullish for traditional assets, temporarily.
Figure 7. The Inflation Head Fake of 2022
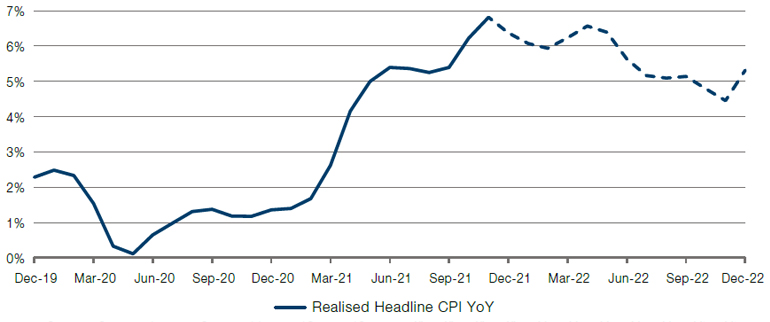
Source: Data for US (headline CPI NSA). Historic inflation readings from Bloomberg. Man Group projection is based on the following: energy to trace a third of the move of a blended basket of gasoline, natural gas and coal futures, assuming a reversion to the post-2006 mean for these commodities over the next year. OER and Rent of Shelter to both trace a third of the move in the Case-Shiller house price index, with an 18-month lag. Food at Home to trace a tenth of the move of a blended basket of the following futures contracts: wheat, lean hogs, live cattle, milk, orange juice, coffee, sugar, cocoa and soybean oil, with a 12-month lag. Used cars to trace the Manheim used cars at auction index with a 6-month lag. All other components to revert to their pattern of movement in the last cycle (2008-19).
A New Regime of 4%+ Deficits and 3-6% Inflation?
We continue to believe we are transitioning from the old pre-2020 world of 1-2% inflation to a new post-2021 world of 3-6% inflation with more volatility. This is a bearish development for traditional assets, not a bullish development.
- The old world consisted of 2-3% budget deficit and 1-2% inflation;
- 2021 showed double-digit budget deficits and 5%+ inflation;
- The new world, we believe, will consist of 4-8% budget deficit and 3-6% inflation with more volatility.
This, we believe, is the key challenge for next year – to not draw too much comfort from peak inflation early in the year, and to recognise that one should have a plan in place for when disruptive inflation starts to hurt traditional assets.
A Word on Bonds
It is obvious that nominal US 10-year bonds at 1.5% while headline CPI is 7% do not offer value, to say the least. However, while we expect higher inflation for longer, we would caution against translating that into an expectation of much higher 10-year rates. The world has high leverage and could not cope with much higher rates; central banks would be able to step in quite quickly again through bond-buying programmes, if needed; and institutional investors continue to be hungry for yield as well, even at low levels.
To that latter point, Figure 8 struck us. The Milliman 100 Pension Funding Index is closing in on 1.00 i.e., indicating that the 100 pension funds that constitute this index are close to being fully funded after market moves in 2021. These pension funds could be keen to lock in their fully funded status by de-risking and buying bonds. Add to this that bank deposits have soared, which could provide further demand for bonds. All in all, this illustrates that rates do not need to rise an awful lot from here, even if inflation stays stubbornly high.
Problems loading this infographic? - Please click here
1. From 1876 to present.
2. The model takes a number of inputs (see Figure 2 footnote for details) to give a prediction of where the ISM Manufacturing PMI will be in nine months’ time.
3. Recession defined as GDP contracting for two consecutive quarters.
4. Source: Bloomberg.

You are now leaving Man Group’s website
You are leaving Man Group’s website and entering a third-party website that is not controlled, maintained, or monitored by Man Group. Man Group is not responsible for the content or availability of the third-party website. By leaving Man Group’s website, you will be subject to the third-party website’s terms, policies and/or notices, including those related to privacy and security, as applicable.