This article first appeared in Forbes here.
Markets like these are enough to make anyone suspect foul play. Surely some malign force lies behind the double-digit losses across equities and bonds?
100 years ago, a young anthropologist named Edward Evan Evans-Pritchard wanted to understand the origins of such superstitious beliefs and the urge to blame the occult. His field work took him to the Upper Nile region and the Azande people. He did not have to press hard to discover their concept of witchcraft. “Mangu, witchcraft, was one of the first words I heard in Zandeland, and I heard it uttered day by day throughout the months,” he reported in his landmark 1937 study, Witchcraft, Oracles and Magic Among the Azande.
One example distils Evans-Pritchard’s thesis perfectly. Old buildings would occasionally collapse. Sometimes people would be injured when the building fell. Witchcraft would be alleged. Someone might challenge this claim by observing that termites had eaten through the wood holding up the building, and so dismiss the accusation. But this was not the point. “Every Zande knows that termites eat the supports in course of time and that even the hardest woods decay after years of service,” Evans-Pritchard explained. “That it should collapse is easily intelligible, but why should it have collapsed at the particular moment when these particular people were sitting beneath it?”
We have no explanation of why the two chains of causation intersected at a certain time and in a certain place.
Well, that’s just bad luck, we might respond. And that is Evans-Pritchard’s essential insight: is believing in luck really so much more logical than believing in witchcraft? A building’s integrity was undermined by termites. Some people were sitting in that building. “To our minds the only relationship between these two independently caused facts is their coincidence in time and space,” wrote Evans-Pritchard. “We have no explanation of why the two chains of causation intersected at a certain time and in a certain place, for there is no interdependence between them. Zande philosophy can supply the missing link.”
Hexed by Jay
You don’t find many serious-minded investors bemoaning their luck, or not out loud in public at least. They have a process, they conduct rigorous research, they have experience and theory on their side, so how can they have lost money? They may not cite witchcraft explicitly, but you will undoubtedly have seen and heard many portfolio managers or more casual investors and pundits insist that central bankers (or meme traders or some other supposedly irrational actor) have bewitched the markets that have turned against them. And this isn’t just a bear-market phenomenon – plenty of those on the wrong side of the long preceding rally spent those years complaining about Fed puts, QE manipulation and the rest of it. Now, of course, the problem is apparently the ‘policy mistake’ of hiking rates too high, too fast.
That 60/40 portfolios should collapse is easily intelligible, but why should they have collapsed at the particular moment when I owned them?
But shouldn’t investors have known about the risks creeping into their portfolios – the rising equity valuations, record-low interest rates, geopolitical tensions, disrupted supply chains among others – like the termites burrowing into the beams? To channel Evans-Pritchard: “That 60/40 portfolios should collapse is easily intelligible, but why should they have collapsed at the particular moment when I owned them?”
Down markets are not fun, and we shouldn’t underestimate the effect they have on those investing on shorter timeframes. But they can serve two valuable functions. One is giving longer-term investors better entry points (which is no consolation to those near retirement or who needed immediate liquidity for whatever reason, I know). The other is reminding us all of the importance of discipline when investing.
Take Risks, But Manage Them
I’m not referring to market discipline in the ‘creative destruction’ sense imagined by Schumpeter. Instead, I simply mean risk management. Risks are often rewarded – most evidently in the long equity rally – but can be punished too. The Fed has a dual mandate; neither of these is to ensure asset prices always go up.
Unfortunately, investors may not be able to rely on traditional asset allocation and trust bonds to have a negative correlation to stocks. Maybe that dynamic will reassert itself when interest rates start to fall again, but that could be further off than many expect. I would argue, then, that the solutions should be to focus less on riskmitigating assets and more on risk-management strategies.
Focus less on risk-mitigating assets and more on risk-management strategies.
This is undoubtedly harder than trusting a nominally defensive asset to perform in all conditions, but on the other hand do get in touch if you know of any all-weather stores of value (crypto evangelists should save themselves the effort of writing). Start instead with portfolio construction. An obvious, but sometimes neglected, point is that the more uncorrelated strategies you have in a portfolio, the lower its volatility should be (Figure 1).
Figure 1. Diversification Brings Down Volatility at Portfolio Level
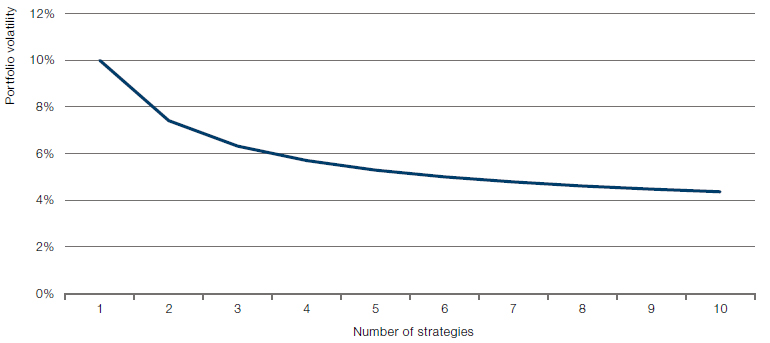
Source: Man Group; June 2022. For illustrative purposes only.
The word ‘uncorrelated’ does complicate matters, as any 60/40 investor will tell you after this chastening year. My multi-strat colleagues produced this helpful illustration of an alternative way to think about allocations (Figure 2).
Figure 2. Hierarchical Clustering Within a Hypothetical Portfolio
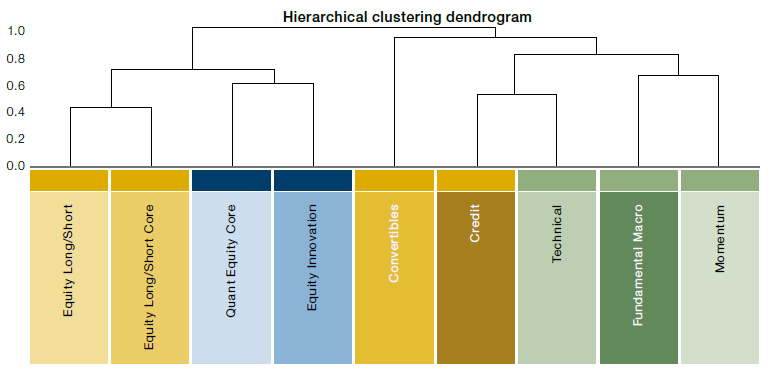
Source: Man Group; June 2022. For illustrative purposes only. Clustering based on correlations of five-day market returns since 2016.
This kind of clustering exercise uses advanced mathematical techniques to group strategies together in a risk hierarchy. Some of the conclusions are intuitive, but have the advantage of being backed by systematic research. Others yield more surprising insights: momentum and fundamental macro may feel like they play different roles in portfolios, but too much exposure to both may concentrate risks in an unexpected way.
Are there performance-enhancing hedges, or are we stuck with performance-dragging hedges?
Further along the complexity spectrum, you may be familiar with tail-risk hedges. These are normally based on derivatives with a defined payoff profile, rather than assets merely expected to act as safe havens like the dollar or Treasuries. The trouble is that these hedges, like all insurance, cost money and can therefore weigh on performance in strong markets. Are there instead performance-enhancing hedges, or are we stuck with performance-dragging hedges? We recently tried to quantify the answer to this question, focusing on creating portfolio convexity – a return profile that is highly positive at either extreme of market performance without being negative in the middle.
The whole analysis is worth reading, but this chart makes the main point (Figure 3). Basically, investors want to stay above 0% on the vertical axis regardless of the S&P 500 performance (the horizontal axis). The blue dots represent rolling monthly puts as a standard hedge. You see immediately that there are plenty of blue dots in the top left, signifying positive returns when the market is down. But these come at the cost of the blue dots in the bottom right – the negative carry from holding hedges when equities are gaining. The yellow dots represent a strategy that is 75% systematic (combining trend-following, the Quality Minus Junk factor, and volatility- and correlation-based overlays) and 25% rolling monthly puts; the left-tail payoffs are still there, but without such a drag on the right-hand side.
Figure 3. Rolling 3-Monthly Returns: Monthly Puts Vs. Systematic & Tail Hedges
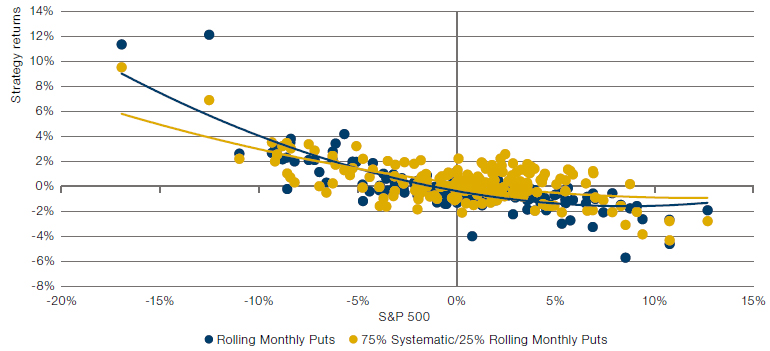
Source: Bloomberg data, Man Group calculations. Monthly data, May 2007 to April 2022. Please see the important information linked at the end of this document for additional information on hypothetical results.
Simulated past performance is not indicative of future results.
Risk management and portfolio construction, old-fashioned concepts applied innovatively.
Building strategies with such a performance profile isn’t down to magic, witchcraft or luck. It’s risk management and portfolio construction, old-fashioned concepts applied innovatively. You don’t have to be as intrepid as an anthropologist to find them in practice, but sharing an anthropologist’s curiosity helps.
You are now leaving Man Group’s website
You are leaving Man Group’s website and entering a third-party website that is not controlled, maintained, or monitored by Man Group. Man Group is not responsible for the content or availability of the third-party website. By leaving Man Group’s website, you will be subject to the third-party website’s terms, policies and/or notices, including those related to privacy and security, as applicable.