The Storm
As spring blossoms into summer, the changing seasons have not brought a reprieve from difficult conditions in credit markets. Total returns continued to remain weak over the quarter with many indices across investment grade (‘IG’), high yield (‘HY’) and convertible bonds (‘CBs’) delivering the worst total returns since inception of indices (Figure 1).
Figure 1. Total Returns – Corporate Bonds
Problems loading this infographic? - Please click here
Source: Bloomberg, ICE BofAML; as of 30 June 2022.
Amidst the chaos, there has been one beacon of consistency: sadly this has been elevated interest rate volatility, which has done little to help bond investors.
Amidst the chaos, there has been one beacon of consistency: sadly this has been elevated interest rate volatility, which has done little to help bond investors (Figure 2). Higher inflation readings and adjusting narratives from a number of central banks have continued to push rates higher and were a significant driver of returns over the month.
Figure 2. MOVE Index
Problems loading this infographic? - Please click here
Source: Bloomberg, ICE BofAML as of 30 June 2022.
The market was also dominated by decompression with lower-rated segments of the market underperforming higher-rated components.
Spreads have also widened across the board over the quarter (Figure 3). HY and leveraged loans suffered over the quarter with spreads leading the way wider as growth concerns started to be priced into the market. A theme that we observed was the more significant underperformance of Pan-European IG and HY markets which we think is creating some value opportunities for medium term investors. The market was also dominated by decompression with lower-rated segments of the market underperforming higher-rated components.
Figure 3. Change in the Option-Adjusted Spread
Problems loading this infographic? - Please click here
Source: Bloomberg, ICE BofAML; as of 30 June 2022.
Convertible bonds delivered double-digit negative returns over the quarter. Nearly 15% of the market now trades in ‘busted’ territory with bond floors offering little protection. A number of names now trade with high equity sensitivity despite embedded options being deeply out of the money. However, we would argue that this presents an opportunity: of the top 10 peak-to-trough declines, the global CB market then rallied a median of 10%, 16%, and 40% during the following six, twelve and twenty four months, meaning that now may actually represent a good entry point for CB investors.1
While Q2 has been exceptionally difficult, it is important to note that the recent underperformance has led to more attractive underlying yields and more value in credit spreads, especially in IG credit (Figure 4). From a valuation perspective, we are further encouraged. Valuations have improved across the board with European IG looking particularly attractive. Figure 4 shows that credit spreads (the yellow dot) are at or above the third quartile (the upper edge of the box plot) in these regions, although Asian and EM IG remains closer to long term averages. Value is also starting to emerge particularly in Pan-European HY and if spreads continue to widen this could present a better buying opportunity in Q3 and Q4. For now we think it remains an active manager’s environment with certain sectors such as healthcare and consumer staples looking cheap and other more cyclically-oriented sectors remaining expensive.
With such an increased margin of safety, we would argue that we may be at a much better entry point than previously.
The yield cushion that investors now receive against higher rates or spreads remains far more attractive compared to end of last year, when much of the credit world was exceptionally expensive. With such an increased margin of safety, we would argue that we may be at a much better entry point than previously. Indeed, history suggests this may well be the case: 12-month forward returns to the ICE BofAML Global Large Cap Corporate Index after the 10 largest drawdowns has delivered a median return of 7%, 11% and 15% over 6 months, 12 months and 24 months respectively. Indeed a similar dynamic can be seen in HY bonds showcasing a median return of 20% in the 12 months post the 10 largest drawdowns since inception (Figure 6).
Figure 4. EUR IG Valuations Starting to Price in Recessionary Conditions
Problems loading this infographic? - Please click here
Source: Bloomberg, ICE BofAML as of 30 June 2022.
Figure 5. HY Valuations Starting to Look Attractive Given Relatively Benign Default Backdrop
Problems loading this infographic? - Please click here
Source: Bloomberg, ICE BofAML as of 30 June 2022.
Figure 6. Forward Returns Post 10 Largest Peak to Trough Drawdowns
Problems loading this infographic? - Please click here
Source: Bloomberg, ICE BofAML as of 30 June 2022.
Manager Outlooks
At Man GLG, our overriding principle is that we have no house view. As such, portfolio managers are free to execute their strategies as they see fit within pre-agreed risk limits. Keeping that in mind, the outlooks below are from the different credit teams at Man GLG.
Despite our more positive outlook we continue to think it is not a time to own the entire market.
Investment Grade: All-in yields continue to zoom higher and with spreads moving above the third quartile, we are becoming more and more optimistic on this segment of the market by the day. Looking at the Global IG market we find that almost 4500 securities yield above 5% which is an increase of over 90x since September 2021. In addition to the all-in yields we do see value in owning duration within an overall asset allocation, as it could offer diversification benefits should growth start to falter and central banks pull back on rate hike expectations.
Despite our more positive outlook we continue to think it is not a time to own the entire market. Sectors that we prefer include real estate, alternative financials and commodity traders within the energy market. Sectors where we retain caution include cyclically-oriented parts of the market as well as in subordinated financials where we have minimal exposure. Finally, on a regional basis we have a strong preference for Europe with spreads and all in yields looking attractive relative to the US in particular.
Figure 7. Number of IG Corporate Bond with Yields Above 5% - 90x Increase
Problems loading this infographic? - Please click here
Source: Bloomberg, ICE BofAML as of 30 June 2022. Index utilised: ICE BofAML Global Large Cap Corporate Index.
These sectors are less geared to the economic cycle and can continue to deliver cash flows during periods of economic slowdown and also retain the ability to pass on higher prices to consumers without eroding demand which is critical in the current inflation regime.
High Yield: HY tells a similar story to IG, with all-in yields slowly returning to historical norms and the asset class starting to offer yields in line with its name. With spreads approaching 600 bps, we are starting to feel more positively towards portions of the asset class. Set against what we expect to be a lower default environment than prior cycles, we believe that investors are starting to be rewarded for allocations to the sector (Figure 8). However, given the slowing growth environment and higher inflation we do not believe that it is a time to own the broader market and believe that selectivity will be the key. We find attractive opportunities in Pan-European HY, with a focus on those non-cyclical portions of the market such as healthcare and consumer staples. These sectors are less geared to the economic cycle and can continue to deliver cash flows during periods of economic slowdown and also retain the ability to pass on higher prices to consumers without eroding demand which is critical in the current inflation regime .The US continues to be an area where we retain a cautious outlook on cyclical sectors such as basic materials and autos. This is also true of the energy space where we see pressures from the demand side impacting margins.
Figure 8. 2-Year Average Forward Returns, Based on Various OAS Starting Points
Problems loading this infographic? - Please click here
Source: Data between January 2006 and 30 June 2022, in EUR.
Emerging Market Debt: The situation in EM continues to look challenging. Without a significant turnaround in inflation trajectory, we believe it is hasty to conclude that a slowdown in US growth will hamper the Fed's willpower to tighten monetary conditions. Beyond the tightening financial conditions in DM, EM headwinds also include portfolio outflows, a stagflationary macro backdrop, commodity supply risks from the Russia-Ukraine war and rising stress (particularly in frontier market countries). Rising inflation and lower growth, particularly in the US and China, are not supportive for EM currencies and credit spreads, particularly in more vulnerable commodity importing countries with existing vulnerabilities from high debt levels. Additionally, renminbi weakness and a more uncertain outlook for commodity prices may continue to test EM FX resilience, despite their already depressed level by historical standards. EM inflation is not yet under control and has been rising faster than policy rates in most countries, leading to more negative real interest rates currently than a year ago. Thus, local rates are likely to be kept under upward pressure, in our view.
The quantity of bonds trading at distressed levels is unprecedented.
International Distressed and Special Situations: We are seeing some interesting price action across both EM sovereigns and areas of the European credit market. These assets have been under pressure since earlier in the year although the broader sell-off has morphed from one that had been in line with the rates induced sell-off to one that has accelerated. Further to this, the extreme price action appears to be possibly forced and/or liquidation type behaviour. The quantity of bonds trading at distressed levels is unprecedented (USD875 billion as at 21 June) and we believe this flow-driven price action, in many cases disconnected from underlying fundamentals, is creating significant buying opportunities for distressed buyers able to weather this market downturn. Many of these situations will likely result in post-restructuring recovery values significantly above current trading levels which are a function of the lack of dry powder available to buy international and emerging market stressed and distressed bonds. Current areas of focus for us include:
- Developed Europe Corporates:
- This sector has been historically unattractive for long periods of time, often characterised as "bad businesses with bad balance sheets" with a predominance of LBO capital structures. Senior debt is often held by CLOs that have not been forced sellers, and only the very junior parts of the capital structure trade distressed;
- Most recently, we are starting to see better opportunities arise as the "reopening trade" fades and a new post-Covid monetary and economic landscape emerges;
- Additionally seeing opportunities in European stressed opportunities in currently or formerly IG issuers with selling pressure seeming to be higher for larger capital structures.
- EM Sovereigns:
- A combination of deficit spending, low interest rates and fund inflows has led to a significant increase in EM sovereign bond issuance with a duration of more than ten years – with a corresponding rise in leverage;
- The Covid-19 pandemic further fuelled significant increases in deficits and debt issuance, adding to an already vulnerable landscape, and caused some of the most vulnerable sovereigns to default in 2020;
- A possible regime change in global interest rates augurs an increase in EM sovereign debt trading at distressed levels, and a broader opportunity set for investors.
- EM Corporates:
- During the pandemic, corporate risk was partially shifted to government; we believe the inevitable unwind will create a broader opportunity set as governments look to rein in spending and repair their deficits.
- The current situation provides many more attractive opportunities than we have seen over the past decade, with the pick of litter predominantly in Latin America and Eastern Europe.
Convertible Bonds: 2022 has seen the worst-ever start to the year for risk assets and for global convertibles specifically, performance has additionally been impacted by the asset class’s underweight exposure to many of the sectors that have outperformed year to date. In addition, convertibles bonds have significant exposure to high-multiple/high-growth issuers that have been impacted to a greater degree by rising rates.
However, now opportunities are starting to emerge within the asset class:
- All-in yields have moved back into positive territory. Around 60% of the market now trades with a positive yield-to-worst, while nearly 90% of 2021’s deals offer some yield. This also provides opportunities for traditional fixed income investors to access different parts of the market (since the majority of CB issuers have only CB debt on their balance sheet);
- More asymmetric bond profiles – Growth stock valuations have declined sharply, with convertibles now offering a more asymmetric profile from an upside/downside perspective, trading at historically low premiums to their bond floors;
- More than 15% of global CBs are trading in busted territory, where the equity option is deep out of the money, and the bonds trades below 80 cents on the dollar. These are largely in the high-growth part of the market. We have to go back to March 2020 to see a similar level of busted bonds. Historically these have outperformed when the dust settles;
- Two thirds of the market doesn’t come due until 2025 or after (i.e. the bonds have no immediate maturity wall to worry about), which provides time for markets to normalise before worrying about debt repayments or defaults;
- The number of takeovers has been elevated within the convertible bond space, with 2022 representing a 6-year high. We may continue to see some of these oversold companies, with good products but weak or negative earnings, acquired by larger competitors or strategic buyers. As a reminder, convertible bond investors gain from M&A by way of an embedded ratchet mechanism that boosts returns;
- Some interesting relative value opportunities persist, as many convertible bonds are trading cheap versus straight bonds from the same issuer. This allows investors to pick up the equity option for free and also gain from spread normalisation between straights and convertibles.
Figure 9. Convertible Bond Fair Value – All Regions Are Offering Value
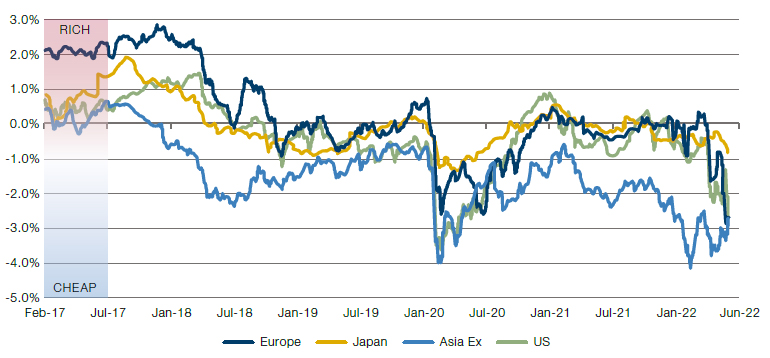
Source: Jefferies as of 30 June 2022.
Figure 10. Q2 2022 and YTD Returns – Convertible Bonds (USD)
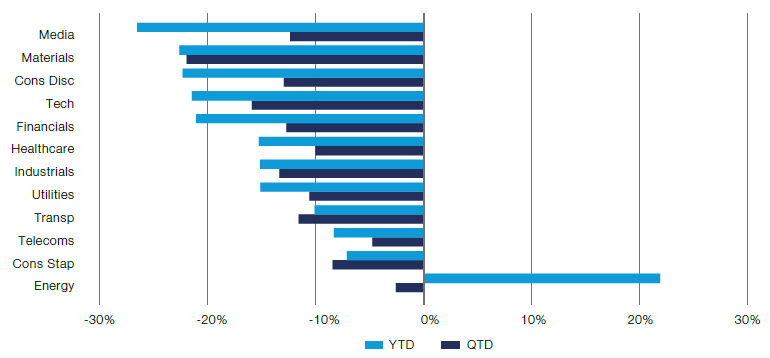
Source: ICE, BofAML as of 30 June 2022.
Convertible Bond Arbitrage: With CBs trading at cheap valuations, the basic premise of convertible bond arbitrage remains as attractive as it has been in some time. As the chart above highlights the CB market has experienced significant rebounds post historical drawdowns and with all in yields moving into positive territory we are being compensated more as we wait for a move back to theoretical fair value. With stock valuations coming down in a broad range of healthcare and technology sectors we believe that M&A activity could start to accelerate from relatively low levels once we see some stability re-appear within the market. As a result of wider credit spreads and higher interest rates, convertible bond make whole provisions for M&A are at historically attractive levels. Finally, with 50% CB market trading below par and many healthy companies trading at busted dollar prices we find attractive opportunities in companies that remain cash flow positive with low levels of net debt.
1. Source: BofAML as of May 2022.
You are now leaving Man Group’s website
You are leaving Man Group’s website and entering a third-party website that is not controlled, maintained, or monitored by Man Group. Man Group is not responsible for the content or availability of the third-party website. By leaving Man Group’s website, you will be subject to the third-party website’s terms, policies and/or notices, including those related to privacy and security, as applicable.