Key takeaways:
- In risk management, it is vital to consider what may happen and not solely what is most likely to happen
- Stress testing, identifying direct or indirect portfolio exposures and examining implied volatilities from options markets can all help to understand the risks posed by an event
- Regardless of the level of preparation, there’s always the possibility of an unforeseen event
Introduction
Event risk, has been in abundance this year -- be it from regular earnings reports, CPI prints, “Fedspeak” or the more than 50 elections taking place across the world in 2024.
Being prepared can mean many things: thinking ahead, being ready to be surprised, having the tools to respond and, crucially, anticipating risk from events.
The latter, event risk, has been in abundance this year -- be it from regular earnings reports, CPI prints, “Fedspeak” or the more than 50 elections taking place across the world in 2024.
As risk managers, we need tools to understand the risks associated with these events. In this paper, we will consider how investors might prepare for known event risks, with a particular focus on the upcoming US presidential election, which continues to keep us on our toes, as well as the French legislative election, from which we can draw some important insights.
Navigating uncertainty
One of the most frequently used tools to understand the risks associated with an event is stress testing. Often described as a combination of art and science, it focuses on two key questions:
1. What are the outcomes which are outside of expectations?
2. Which scenarios would lead to a significant loss?
While the former tends to be discussed widely, not just across trading floors, the latter, called a ‘reverse stress test’, can be just as instructive. In a nutshell, it involves working backwards to understand which scenarios would impact a portfolio most. Having identified these scenarios, we then need to assess their likelihood, and whether we would recommend any mitigative action.
Applying this approach specifically to elections, given nearly half of the world’s population goes to the polls in 20241 , we start by asking the following questions, which we will examine in turn:
- What are the potential outcomes of the event?
- Has the event been priced into the market, and what is the level of uncertainty?
- Do we have any direct or indirect exposures to the event?
- What are the different scenarios we could face, both likely and unlikely?
- Do we believe that the current correlation structure will be stable in an event?
It is also vital to always keep in mind how quickly a situation can change.
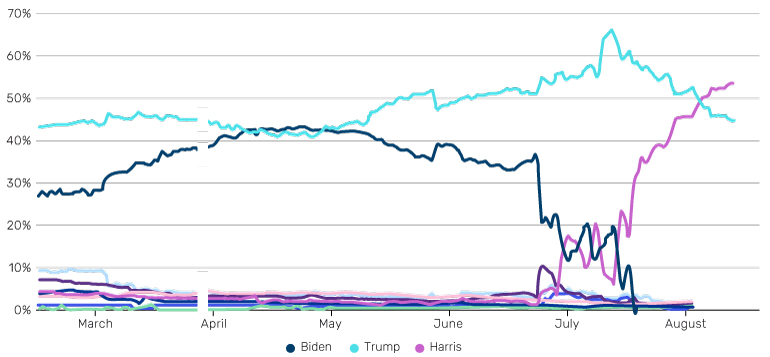
It is also vital to always keep in mind how quickly a situation can change. As an illustration of this, let’s quickly review what has happened since the end of June in relation to the upcoming US election:
1. The Donald Trump versus Joe Biden debate – we see market moves through the debate as Biden’s health is questioned. The market focuses on ‘Trump Trades’
2. The assassination attempt on Trump
3. Biden drops out of the race and endorses Kamala Harris as the Democratic candidate
4. Harris is confirmed as the Democratic nominee
And there is still a long way to go before the election!
Watching the betting odds gives another indication of the uncertainty surrounding the outcome of the election.
Figure 1. Betting odds of US presidential election outcomes

Source: Real Clear Polling, as at 16 August 2024.
Available here: https://www.realclearpolling.com/betting-odds/2024/president
Measuring direct and indirect exposures
Even in a “two-horse race”, we need to anticipate outside possibilities and resist conventional wisdom.
The message is clear. Even in a “two-horse race”, we need to anticipate outside possibilities and resist conventional wisdom.
In an effort to benefit from “the only free lunch” in investing, many investors build diversified portfolios. However, this creates a challenge: how do you understand the exposures that are driving your portfolio? This is hard enough to do in normal times, but in the run up to an election, it becomes even more difficult: recent market dynamics (upon which factor models are often based) may no longer be relevant.
Instead, it can be more instructive to identify factors that specifically relate to the outcome of the election and measure a portfolio’s sensitivities (through direct holdings, betas, or otherwise) to those.
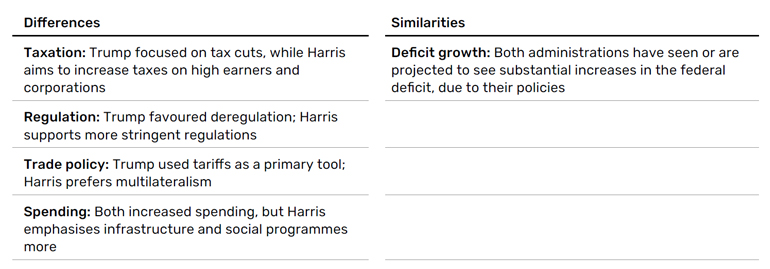
Depending on the nature of the portfolio, how to do this may vary. For a macro futures fund, it would make sense to assess the potential impacts on wider market prices. Conversely, for a cash-equities portfolio, an investor could identify custom baskets of stocks that would be impacted differently by the various candidates’ policy platforms. In Figure 2, we highlight some of the key differences and similarities between the party manifestos based on what we’ve seen so far.
Figure 2. Key differences and similarities between US Republican and Democrat manifestos

An alternative approach is to work backwards: find the top factor drivers of a portfolio (as identified by simple regressions or more complex methods) and then evaluate policy implications for those specific factors.
Either way, identifying the factors that could drive the portfolio and are likely to be moved by an event is a crucial step in being prepared.
Anticipating the unpredictable: risk scenario generation
In risk management we care about what may happen as opposed to just what is most likely to happen.
Our goal is to understand how different election results could affect markets, and by implication, portfolios. Sell-side research can be a good starting point, but this is often in the form of specific predictions, whereas in risk management we care about what may happen as opposed to just what is most likely to happen.
Another option would be to look at past election moves. This may give some insight but it is likely to yield a small sample of quite heterogenous events from different eras, all with a questionable bearing on what will happen in the future.
Instead, we can turn to examining implied volatilities from options markets, which can be (loosely) interpreted as traders’ estimate of how much a market is expected to move over the election window. This has the advantage of being forward-looking and marked-to-market: as polls and other news changes, this will update in real time.
For example, the below plot shows S&P 500 implied volatility (in daily terms) over the 2020 US presidential election, as estimated using the weekly contract expiring just after the election, where we can see that the market was pricing in a 2.5% S&P 500 expected move (either way) over the event.
Problems loading this infographic? - Please click here
The solution is to look at forward implied volatilities.
One weakness in the above approach is that spot starting options are essentially an estimate of market moves from now until the expiry of that option, not the election date move itself. We can see this in the above plot where options only ‘price in’ the election once the one-week option covers the event. This may not be too much of an issue if the election date is close and there are many liquid option expiries to choose from, but for investors who want to be prepared well ahead of time, it poses a challenge.
The solution is to look at forward implied volatilities: i.e. the market’s estimate of market moves on the specific future date of the election. Under simple modelling assumptions this can be derived from spot-starting options and can be calculated quite precisely in markets where there are many liquid expiries, such as in foreign exchange (FX). For example, the below plot shows the forward overnight implied market move on the night of the 2020 US Election for EUR/USD.
Problems loading this infographic? - Please click here
It’s worth emphasising that these are still akin to expected sizes of market moves – they do not give any indication of the direction nor which moves are possible. For this we need to turn to the full options surface across different strikes, from which it is possible to derive a market implied probability distribution for possible levels of the S&P 500 following the event. This could then be used to estimate risk metrics like Value-at-Risk, either through Monte-Carlo simulations2 or simple quantiles, depending on the complexity of the portfolio. For example, the below plot shows the probability distribution of S&P 500 moves by the 2024 US Election, as of 22 July 2024.
Problems loading this infographic? - Please click here
However, as with any estimation tool, there are limitations to be aware of:
1. There is no guarantee that the probabilities of events as derived are ‘correct’: the market may be mispricing certain outcomes or not considering them at all
2. Data availability can be a challenge: options are not liquid in many regions so getting good estimates may be difficult
3. As option afficionados will be quick to point out, these are strictly speaking “risk-neutral” probabilities, not “real” probabilities so we shouldn’t expect these to be perfect estimates of likelihoods in the first place. This is where human expertise comes in - to piece the available data together into a coherent range of outcomes to consider
Learnings from the French election
The recent French legislative election showcased the challenges of political forecasting.
The recent French legislative election showcased the challenges of political forecasting, where first-round results often match national projections, but second-round seat outcomes are harder to predict due to shifting strategies. A UK-style ‘first-past-the-post’ system would have given right-wing party Rassemblement National (RN) a majority, highlighting the impact of the voting system over actual political support.
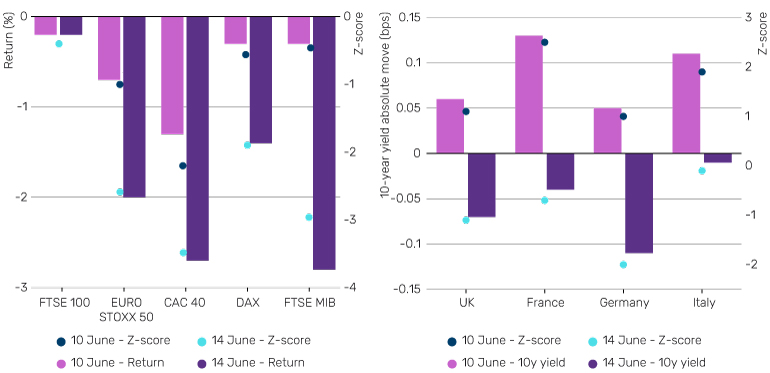
On 9 June, President Macron’s snap election announcement surprised everyone, causing market volatility. The CAC 40, France’s equity index, fell by -1.3% the following day, while European yields and the OAT-bund spread increased. Throughout the week, equities and bonds showed fluctuating correlations, with significant movements in the Euro Stoxx 50, bund yields, and Italian assets.
Figure 6. EMEA equities fell on both 10 and 14 June, while EMEA government bonds fluctuated

Z-score calculated using 1-day volatility (1-day rolling returns with a lookback window of 30 days). Source: Bloomberg, Man Group database, as of 22 July 2024.
After the first round, markets reacted positively as an absolute majority for RN seemed unlikely and attention shifted to the possibility of a hung parliament, given the high number of “triangulaires” (when three candidates in the first round have reached the threshold to remain in the second round).
Following the unexpected second-round results, the market reaction was subdued, with the euro, French stocks, and bonds all hovering near flat, indicating no ‘market-friendly’ outcome. In fact, a degree of political turmoil may be seen as the least detrimental option.
As part of our preparation for the French election, we considered baseline scenarios for the most likely cases, as well as more extreme scenarios not priced in by markets:
- Would the far-right get an absolute majority? Could it be the far-left instead? Could we see a large Macron victory? What would happen if no party had a strong relative majority?
- How would markets behave in all these scenarios? Would the OAT-Bund spread increase or decrease? If so, would this be driven by German yields or French ones?
There were many more questions, and since it was difficult to answer them, we tested different hypotheses, correlations, and contagion scenarios based on portfolio exposures. These scenarios were reassessed continuously until the final second-round results were announced.
Is the correlation structure stable?
The correlation structure does not always hold during periods of uncertainty and can change multiple times in a single week.
Our market observations in relation to the French election highlight several points. Firstly, the correlation structure does not always hold during periods of uncertainty and can change multiple times in a single week. Secondly, the contagion risk is real and significant.
As of 18 July, France held the largest weight in the Euro Stoxx 50 at 39%, and its political turmoil affected many other European bond and stock markets, from Germany to Italy. The iTraxx Main, Xover and senior financials all rose on the week.
Lastly, it seemed that most of the first-round poll results were priced in one week after Macron’s announcement. However, we knew that the final seat results could vary significantly, hence it was crucial to identify the unpriced elements which could potentially cause market panic.
Conclusion: Prepare to increase resilience
There can always be something round the corner that you could not have foreseen.
As risk managers, we believe in the importance of preparation over making predictions. It is essential to analyse a range of potential outcomes, identify factors that could lead to unexpected shifts, and assess portfolios’ resilience against these disruptions. To complement this, it is important to try to understand the market conditions which would be painful for a portfolio. Combining these helps to understand the real exposure to the event without attempting to predict it.
With all that said, perhaps the most important lesson is that however much you prepare, there can always be something round the corner that you could not have foreseen. That’s the truth contained within the phrase “history doesn’t repeat itself, but it rhymes.”
1. Source: https://www.bloomberg.com/news/newsletters/2024-01-11/your-evening-briefing-half-the-world-s-population-and-gdp-is-heading-to-the-polls
2. Monte Carlo simulations are computational algorithms that use random sampling to obtain numerical results. They are often used to model the probability of different outcomes in processes that are difficult to predict due to the intervention of random variables.
You are now leaving Man Group’s website
You are leaving Man Group’s website and entering a third-party website that is not controlled, maintained, or monitored by Man Group. Man Group is not responsible for the content or availability of the third-party website. By leaving Man Group’s website, you will be subject to the third-party website’s terms, policies and/or notices, including those related to privacy and security, as applicable.