Introduction
In our ‘Path Less Travelled’ series on multi-asset sustainable investing, we explore in depth various asset classes. Having previously considered responsible investing in relation to commodities and government bonds, here we examine the role of investment grade (IG) corporate green bonds. Specifically, we look at those bonds that adhere to the ICMA Green Bond Principles1, a widely adopted framework that ensures green bonds live up to their name.
Investors looking to supplement their portfolio with green bonds may wonder how such securities differ quantitatively from conventional debt. What are the structural differences (if any) of the green debt market? Do they have similar yields and risk characteristics? A common perception about green bonds is that demand outstrips supply, but is this true? And what about the so-called green premium or ‘greenium’ effect, where investors accept lower yields in return for holding sustainable debt?
Let’s dive in.
What are green bonds?
Green bonds are debt instruments used to finance environmentally friendly initiatives, such as renewable energy plants, sustainable housing and the greenification of existing industries. Crucially, green bond proceeds are ringfenced and can only be used to fund such initiatives, which is not the case for other sustainable debt instruments such as sustainability-linked bonds (SLBs).
First debuting in 2007, green bonds have gained traction across nations and industries. In the last five years, in particular, issuance has exploded. Indeed, in the second half of 2023, issuance reached $2.5 trillion2, with the majority (51%) of green debt being corporate IG.
Green bonds are a powerful tool for financing sustainable initiatives.
Figure 1 shows the total outstanding amount for green versus conventional IG corporate debt since 2014. To represent each group, we used constituents from two popular bond indices, which we will refer to throughout this paper: the ICE All Maturity Global Broad Market Index (GBMJ), and ICE BofA Green Bond Index (GREN). To be included in GREN, bonds must follow the ICMA Green Bond Principles. While this reduces the risk of greenwashing, it also means that GREN covers approximately 50% of the overall green bond market (as measured by the Climate Bonds Initiative (CBI)2). Nevertheless, we believe that GREN provides a representative sample across the IG green debt space and we will thereby use it as a proxy for the IG green bond universe throughout this paper. Further details about both indices can be found in the Appendix.
Figure 1. The rise of corporate green bonds
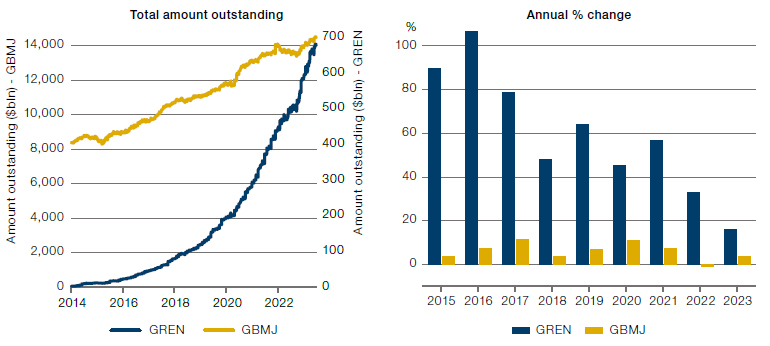
The left panel shows the total outstanding debt in the ICE All Maturity Global Broad Market Index (GBMJ) and ICE BofA Green Bond Index (GREN) over the period from January 2014 to July 2023. The right panel shows the year-on-year changes using the same data.
Source: ICE Data Indices, Man Group.
Green bond issuance has grown rapidly in the last five years, but is still small compared to conventional debt.
As shown in Figure 2, all regions saw increased issuance, but Europe saw the most growth at 275% since 2020. Europe is also the largest source of green debt (60% in GREN versus 30% in GBMJ). Despite this rapid growth, green bonds still make up less than 5% of the IG corporate debt market.
Figure 2. Investment grade corporate issuance by region
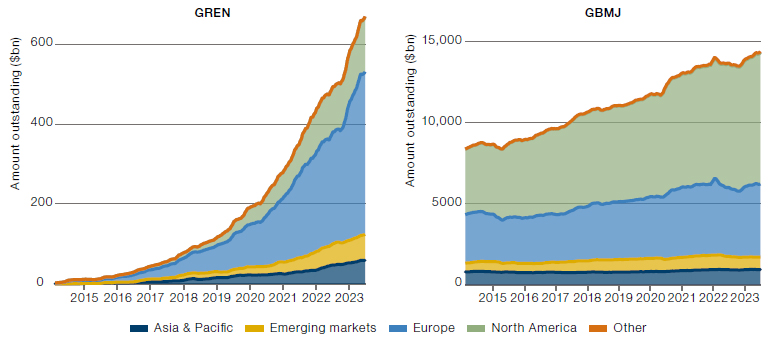
Decomposition of total issuance by region for indices GREN (left) and GBMJ (right), over the period from January 2014 to July 2023.
Source: ICE Data Indices, Man Group.
Why issue green bonds instead of conventional debt?
Beyond the purely philosophical, one argument for issuing green bonds is that it gives issuers access to cheaper credit as investors are willing to accept lower yields (the so-called ‘greenium’) in return for investments that align with their environmental goals. Another argument is that issuers benefit reputationally from issuing green bonds. Issuing green debt does come at a cost, however, both in terms of additional structuring costs and ongoing reporting requirements.
Underling motivations become questionable when issuers stretch the definition of what constitutes a green project, known as greenwashing. This is one of the main challenges facing the green debt market today. To combat this, regulatory bodies and frameworks such as the ICMA Green Bond Principles and EU Green Bond Standards (EU GBS)3 have emerged to guide issuers and investors alike. Crucially, under the EU GBS, investors can align their portfolios with the Paris Agreement4 by holding green bonds.
Anatomy of the green bond market
Green bonds can give issuers access to cheaper credit, as investors will accept lower yields in return for investments that align with their environmental goals.
The anatomy of the green bond market is quite distinct from that of conventional debt. We’ve already highlighted that European corporate debt is the dominant region in GREN, whereas the US holds a majority in GBMJ (Figure 2). In GBMJ, sovereign debt makes up more than half of the market, but it forms less than 20% of GREN. Instead, corporate debt comprises over 50% of the green bond space (Figure 3). Despite the supranational origins of green bonds within the European Investment Bank (EIB), they were primarily conceived as a private sector tool to reduce the financing costs of green initiatives. In general, governments have less trouble raising capital so have less need for green bonds. Nevertheless, sovereign green bond issuance has been rising steadily since 2018, particularly in developing markets. In 2023 alone India debuted its first green bond5 and Germany issued a €5.25bn green bond in March6, one of the largest of the year.
Figure 3. Index composition
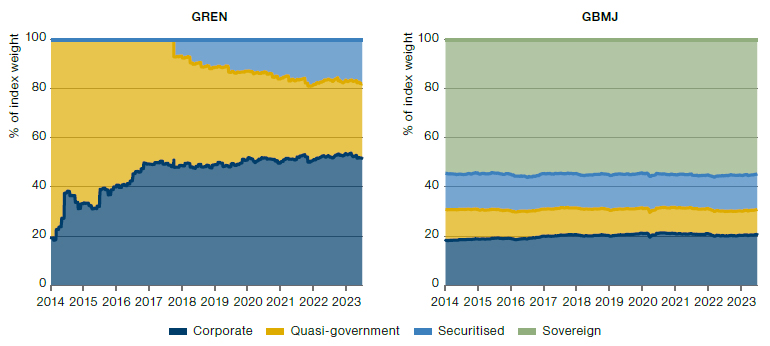
Sector decomposition for indices GREN (left) and GBMJ (right) as a percentage of index weight, over the period from January 2014 to July 2023.
Source: ICE Data Indices, Man Group.
Unlike conventional debt, the majority of green bonds are issued by corporations instead of sovereigns.
By industry, GBMJ is more or less equally distributed, with the exception of Banking, which makes up approximately 20%. In contrast, GREN is dominated by Utilities, Banking and Real Estate. Utilities and housing have obvious uses for green capital, but what about banking? Many banks, in fact, act as intermediaries, issuing green bonds and using the proceeds to fund environmental initiatives.
Figure 4. Investment grade corporate bonds by industry sector
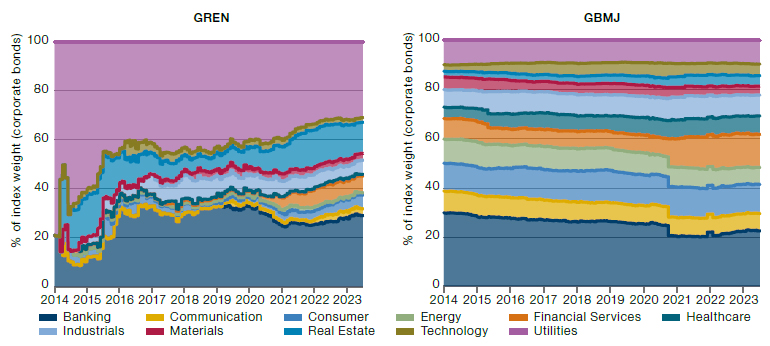
Industry sector decomposition for the corporate bond portion of indices GREN (left) and GBMJ (right) as a percentage of total index weight, over the period from January 2014 to July 2023.
Source: ICE Data Indices, Man Group.
The distribution of credit ratings is broadly similar today within corporates (Figure 5), although pre-2017 the percentage of B-grade green bonds was notably lower than conventional debt.
Figure 5. Investment grade corporate bonds by rating
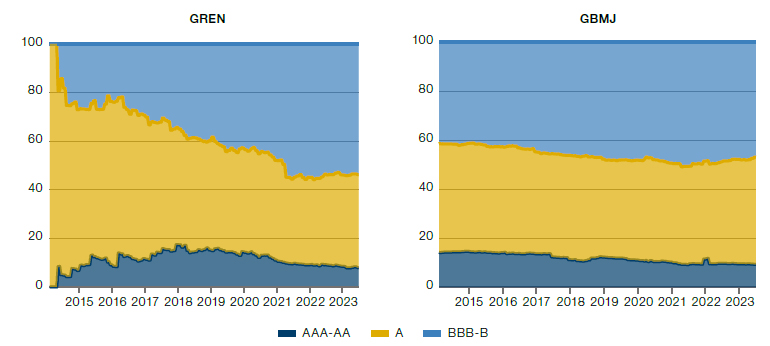
Credit rating decomposition for the corporate bond portion of indices GREN (left) and GBMJ (right) as a percentage of total index weight, over the period from January 2014 to July 2023.
Source: ICE Data Indices, Man Group.
A ‘greenium’ effect?
To control for the regional, sectoral and rating tilts in GREN, as outlined above, we reweighted† GBMJ to create a new version of the index, which we name GBMJ*, that can be used as a fair comparison with GREN.
The greenium is not guaranteed – the credibility of the bond and its issuer are key drivers.
Using this new index, we looked at index-weighted average yield, duration, option-adjusted spread (OAS), and duration times spread (DTS) (Figure 6). We prefer OAS to effective yield as it incorporates the impact of embedded options on a bond’s valuation. For this reason, we use the difference in OAS between green and conventional debt as a measure of greenium7. By this measure, at the index-level, we see a persistent but shrinking greenium up to 2019. Since 2022, we find no sign of a systematic greenium effect in the GREN index (after controlling for tilts). However, for individual bonds the best evidence of a greenium is when a green bond is issued alongside an economically equivalent conventional bond – such as the recent German twin-issuance6, where a clear greenium was observed.
Another topic of debate is whether greenium exists only at issuance, or in secondary markets as well. Clearly the former provides the most immediate benefit to issuers. Indeed, the CBI measures and reports greenium only at issuance. More broadly, findings in ‘The Pricing of Green Bonds’7 suggest that within Europe, only certain sectors (namely alternative energies and banking) enjoy a greenium. Moreover, this greenium is only significant for green bonds that are both ICMA and have undergone external review (i.e. the greenest of green bonds). Both of these criteria point to the credibility of the bond and its issuer as a key driver of the greenium. Undergoing external review can be a costly process, but issuers may deem it worthwhile if it grants them access to cheaper funding.
Figure 6. Index risk measures
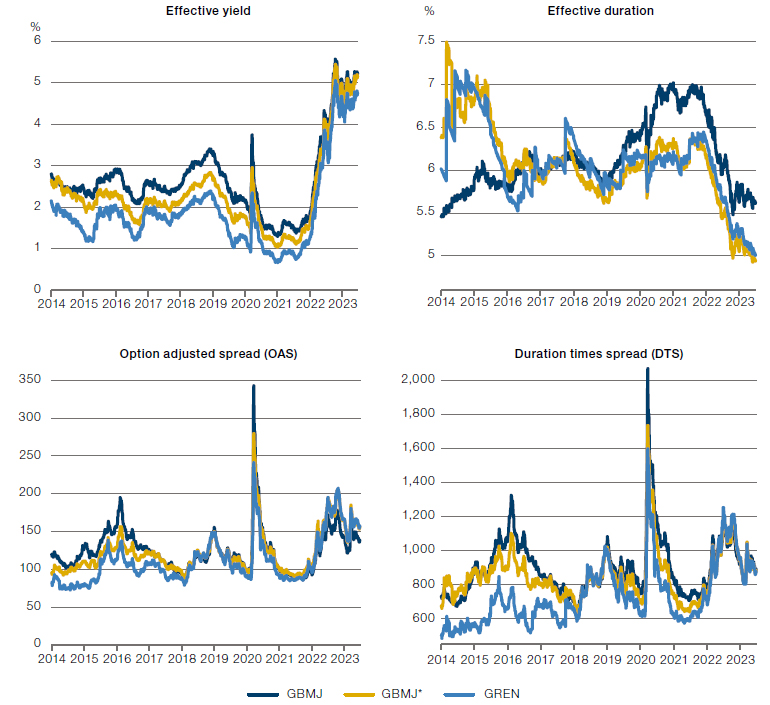
Index-level risk measures for GREN and GBMJ over the period from January 2014 to July 2023. The index GBMJ* represents GBMJ rescaled to have the same regional, sectoral and rating tilts as GREN.
Source: ICE Data Indices, Man Group.
Do green bonds underperform conventional debt?
The long term performance of green and conventional debt is surprisingly similar.
A commonly held belief about green bonds is that they consistently underperform conventional debt; but is this true, and if so by how much? After accounting for regional, sectoral and rating tilts, we see that tracking error is relatively low (about 1% on average) and long-run performance is remarkably similar (Figure 7). Nevertheless, with the exception of 2014 – which was a landmark year8 for green bond issuance – green bond performance has lagged behind conventional IG corporate debt, but the gap is narrowing.
Even with structural tilts included, the long term performance of green and conventional debt is surprisingly similar. That is not to say that they are interchangeable; indeed relative performance and tracking error varies significantly over time. For example, green bonds were particularly badly hit during the 2022 bond sell-off. Also, as previously caveated, the GREN index does not capture all green bonds, so these results do not necessarily apply across green bond portfolios.
Figure 7. Long run performance
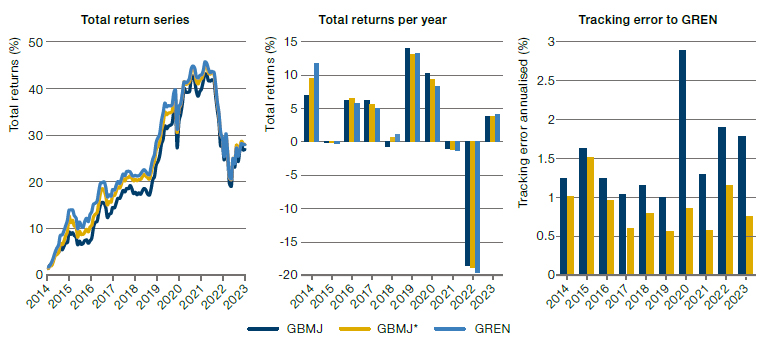
Total return series of GBMJ, GBMJ* and GREN over the period from January 2014 to July 2023 (left), with the annual total returns for the same dataset (middle). The right panel shows the tracking error of GBMJ and GBMJ* to GREN.
Source: ICE Data Indices, Man Group.
What about liquidity?
Green and conventional debt have similar bid-ask spreads and liquidity depth (relative to market size).
Another commonly held belief is that green bonds are less liquid, especially on the buy-side due to high demand. Using Bloomberg’s MSG1 data (see Appendix), we aggregated bid-ask quotes (and USD notional sizes) for bonds in GBMJ and GREN since 2017. We then computed daily bid-ask prices as size-weighted averages across all quotes.
We found that both markets have similar ratios of bid-ask quotes (Figure 8, top) and similar depths relative to total bond issuance (Figure 8, bottom). Although it’s unclear what portion of the bond market is traded through Bloomberg, this suggests that both markets have similar levels of liquidity breadth and depth (relative to total market size).
Figure 8. MSG1 quotes: GREN versus GBMJ
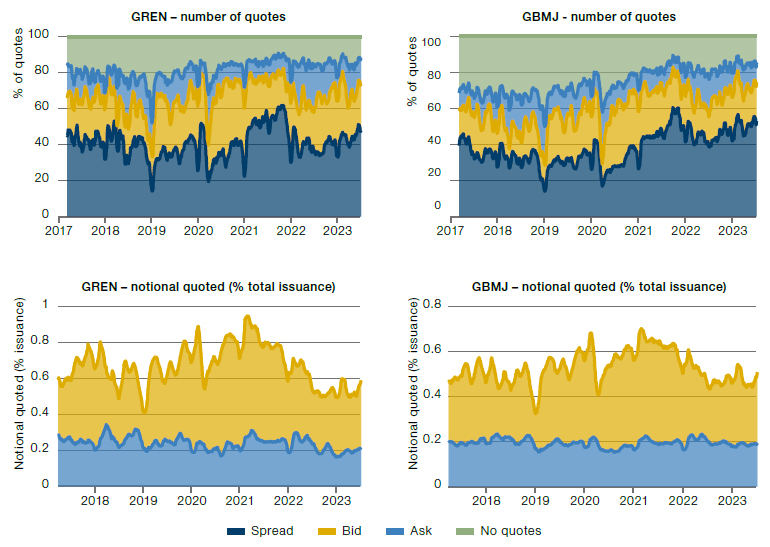
The top panels show the proportion of bonds in GREN and GBMJ with quoted prices (bid, ask, or a full spread) in MSG1, over the period from January 2017 to July 2023. The bottom panels summarise the total notionals from each quote over the same period, as a percentage of the total issuance of each index.
Source: ICE Data Indices, Bloomberg MSG1, Man Group.
Looking at index-weighted average bid-ask spreads, as shown in Figure 9 below, we find that green bonds actually tend to trade with a marginally tighter spread than conventional debt.
Figure 9. Index weighted-average bid-ask spreads
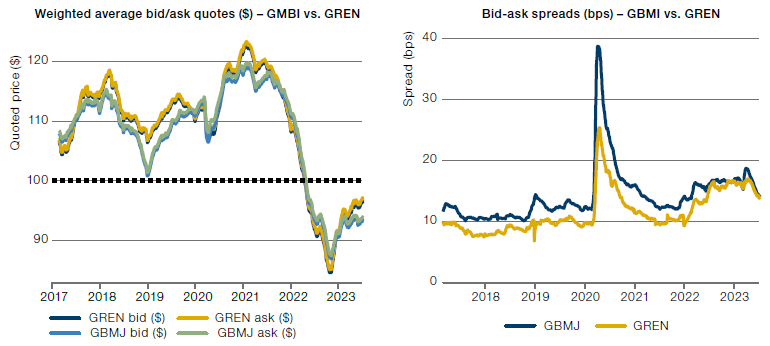
The left panel shows the index-weighted average bid-ask quotes (in dollars) from MSG1 for the GREN and GBMJ indices over the period from January 2017 to July 2023. The right panel shows the bid-ask spread (bps) for each index, inferred from the same data. Bid-ask price series for each bond were computed as a size-weighted average over all MSG1 quotes. The index-level bidask prices were then computed as the index-weighted average bid-ask price.
Source: ICE Data Indices, Bloomberg MSG1, Man Group.
Conclusion
Corporate green bonds represent a powerful tool for financing sustainable initiatives. In the past decade, the green bond market has seen significant growth, with an explosion in new issuance in recent years, but it remains relatively small compared to conventional debt markets.
Our findings indicate a mature and vibrant corporate green bond market.
Comparing green and conventional debt using two popular bond indices, GREN and GBMJ, we have shown that green debt is structurally distinct from conventional debt. While sovereigns reign supreme in conventional debt, corporate bonds dominate the green market. Within corporate debt markets, green bonds exhibit large regional and sectoral tilts, with 60% of bonds issued by European entities and 60% from Banking or Utilities. Despite these differences, we find the long-run performance of green and conventional debt to be surprisingly similar‡ – even after controlling for structural tilts in region, sector and credit rating. We have also explored two commonly cited investor concerns in relation to green bonds: greenium and illiquidity. In both cases, we found that they have not been systematically evident since 2017.
These findings – along with a growing body of regulation and frameworks – indicate a maturing and increasingly vibrant corporate green bond market. This is good news for investors, but it does not mean green and conventional debt are interchangeable. Skill is required to build green portfolios which balance performance with sustainability. But for investors previously apprehensive about corporate green bonds, there are reasons to be optimistic about the path ahead.
Appendix
Data sources
Daily index and bond data was sourced from ICE Data Indices. This includes index constituents and weightings, as well as bond pricing and reference data. Indices are rebalanced monthly.
Bond liquidity data was sourced from Bloomberg’s MSG1 feed. This includes automated batch quotes sent by brokers to Man Group (RUN, ERUN) along with quotes scraped from Instant Bloomberg (IB) and Bloomberg Message (MSG) trades. While IB and MSG quotes are specific to Man Group, RUN quotes – which make up the majority of the data – are common across bond market participants. The data set starts in 2017.
Universe selection and methodology
To compare green and conventional debt markets, we considered constituents from the ICE BofA All Maturity Global Broad Market Index (GBMJ) and the ICE BofA Green Bond Index (GREN). The GBMJ includes investment grade corporate and sovereign debt across most developed markets, with at least one month to maturity remaining. GREN has identical inclusion criteria, with the additional constraint that:
Qualifying bonds must have a clearly designated use of proceeds that is solely applied toward projects or activities that promote climate change mitigation or adaptation or other environmental sustainability purposes, as outlined by the ICMA Green Bond Principles.
Both indices are market capitalisation weighted. The time period analysed was January 2014 to July 2023 (note that GBMJ began only in February 2013 and it was 2014 when the green bond market began to take off).
The combined criteria of credit rating and ICMA Green Bond Principles means that GREN will not capture all green debt. Based on total issuance reports from the CBI, GREN included approximately 50% of the overall green debt market at the end of 2022. Nevertheless, we believe this to be a representative sample of IG green debt, and the ICMA criteria significantly reduces the risks of greenwashing.
References
1 ICMA Green Bond Principles.
2. Climate Bonds Pricing Report 2032H1.
3. EU Green Bond Standards Proposal
4. https://unfccc.int/process-and-meetings/the-paris-agreement
5. https://www.climatebonds.net/2023/03/india%E2%80%99s-debut-sovereigngreen-bond-market-first-deal-landed-greenium
6. https://www.bloomberg.com/professional/blog/german-green-bonds-achieveelusive-greenium-only-just/
7. Similar to: Pricing of green bonds: drivers and dynamics of the greenium, European Central Bank
8. https://www.economist.com/finance-and-economics/2014/07/04/green-grow-themarkets-o
† Formally, we look at the total index weight for each (region, sector, credit rating) bucket, W(r,s,c), then reweight each bond in GBMJ to recover the same bucket weights as GREN i.e.

where ri , si and ci represent the region, sector and credit rating of bond i respectively.
‡ To clarify, our analysis examines green bonds as standalone instruments within the debt market as a whole, and is not a comparison between green bond funds and their non-green counterparts.
The ICE All Maturity Global Broad Market Index (GBMJ) and ICE BofA Green Bond Index (GREN) are products of ICE Data Indices, LLC and are used with permission. ICE® is a registered trademark of ICE Data Indices, LLC or its affiliates and BofA® is a registered trademark of Bank of America Corporation licensed by Bank of America Corporation and its affiliates (“BofA”), and may not be used without BofA’s prior written approval. The index data referenced herein is the property of ICE Data Indices, LLC, its affiliates (“ICE Data”) and/or its third party suppliers and has been licensed for use by Man Group. ICE Data and its Third Party Suppliers accept no liability in connection with the use of such index data or marks.
You are now leaving Man Group’s website
You are leaving Man Group’s website and entering a third-party website that is not controlled, maintained, or monitored by Man Group. Man Group is not responsible for the content or availability of the third-party website. By leaving Man Group’s website, you will be subject to the third-party website’s terms, policies and/or notices, including those related to privacy and security, as applicable.