This article first appeared in Forbes in June 2022.
Bears and doom-mongers have had plenty to feast upon in the news this year, from inflation and the cost-of-living crisis to volatility in everything from blue-chip stocks to cryptocurrencies.
Obviously the recent stress in financial systems is to some extent a reflection of economic issues, in particular inflation. But it’s strange that – until very recently, when stagflation again became a theme – a series of economic prints through April and early May attracted relatively little attention.
US GDP unexpectedly contracted at an annualised rate of 1.4% in the first quarter of 2022. The European Commission slashed its growth estimate for 2022 by 1.3 percentage points. The Bank of England’s forecast is now for the British economy to shrink in the fourth quarter of this year. According to the latest batch of official statistics from China, retail sales in the country dropped by 11.1% year-on-year in April (the largest such fall since March 2020) while industrial production declined by 2.9% over the same timeframe.
There are plenty of ways to rationalise all this as transitory (the result of specific factors like war and lockdowns) and even to be positive on the economic outlook (employment and spending remain solid). It is nevertheless a rapid reversal of the ‘overheating’ narrative we heard through much of last year.
For investors, the real question is whether any of this economic news matters for asset prices. It has become particularly pertinent over the past few weeks of renewed recession chatter, galvanised in large part by some weak updates from large US retailers and the S&P 500 Index briefly entering ‘bear’ territory in late May.
I don’t think many people would argue that outright recessions are good for markets, and bear markets have historically been associated with recessions. Work by LPL Research has highlighted that of the 18 bear or near-bear markets since the Second World War, 10 were followed by recessions. Of the eight that did not, a unifying theme was that the Federal Reserve rode to the rescue.
Figure 1. Bear Markets Which Did Not Lead to a Recession
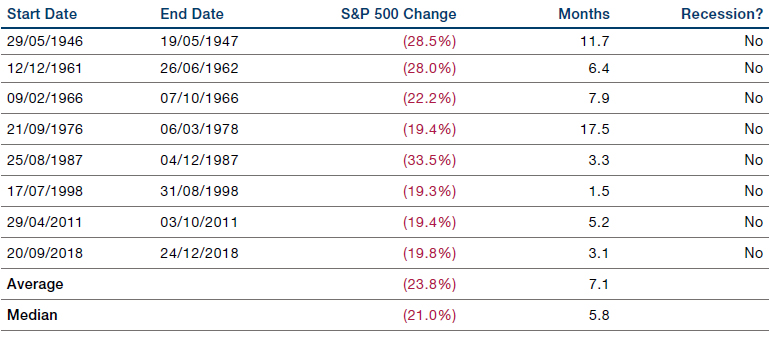
Source: LPL Research, FactSet; as of 13 May 2022.
That does not seem likely this time. The Fed has already hiked US interest rates by 0.5 percentage points to a target of between 0.75% and 1% in May – the largest such increase since 2000 – and more are expected. Of the 15 US tightening cycles since 1950, 10 ended in recession.
Figure 2. Since 1950, 10 of 15 Tightening Cycles Ended in Recession
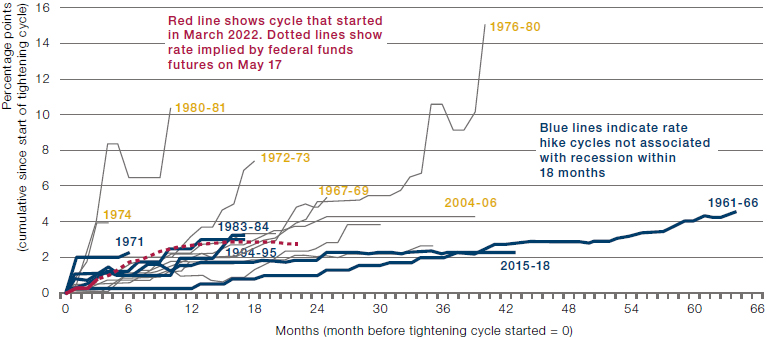
Source: Bloomberg; as of 23 May 2022.
It’s easy to look at all this and become pessimistic about markets’ probable trajectory. How can risk assets be expected to perform well against such a difficult economic backdrop?
As is often the case, though, it can be instructive to reverse the intuition as a thought experiment: are booming economies good for markets?
Here, the experience of China is worth studying. Its economic growth has been phenomenal: from a GDP just over $1.2 trillion in 1992 to around $15 trillion on a constant-currency basis, expanding by a factor of more than 12.
Figure 3. China Gross Domestic Product (Current Prices, US Dollars)
Problems loading this infographic? - Please click here
Source: National Statistics Office. Data retrieved from CEIC. Latest actual data: 2021 National accounts manual used: System of National Accounts (SNA) 2008.
How have Chinese equities fared during this period? Perhaps you’ve guessed the answer is not that they have generated the same 12-fold return. But before we look at their performance, consider that US stocks have grown more than 10-fold since 1992 on an index-price only basis.
Figure 4. MSCI USA Standard (Large & Mid Cap) (USD)
Problems loading this infographic? - Please click here
Source: MSCI; data as of 29 April 2022.
With that context, let’s look at Chinese stocks since MSCI data for them from 31 December 1992.
Figure 5. MSCI China Standard (Large & Mid Cap) (USD)
Problems loading this infographic? - Please click here
Source: MSCI; data as of 29 April 2022.
Yes, the price index is below where it started despite almost 30 years of double-digit economic growth (although it’s up by around 25% on a total-return basis). What explains the disparity?
My colleague Ziang Fang attributed it to structural issues, primarily dating to the early years of this index (most of the underperformance occurred before 2009, including a drawdown of 89% from inception to September 2001). Through this initial period, state-owned enterprises had a significant weight in the index and their shares generally lagged. There was also substantial shareholder dilution within that time.
I’ve focused on China here because it’s such a visceral example of this phenomenon, but it’s not the only one. Widening the geographic lens, we can look at the whole of the Asian economic miracle. My colleagues Andrew Swan and Ed Cole analysed the decade from December 2010 to December 2020, when nominal GDP in Asia excluding Japan grew almost 4.5 times faster than global nominal GDP – but the former’s equities underperformed the latter’s by 25%.
The first conclusion from Andrew and Ed was suitably blunt: “Sack your manager who talks up the prospects of an Asian country’s GDP growth.”
So if you can’t look to economic data for reliable guidance to market performance, where can you look? Unlike many, I’m not going to say that the answer is simply to concentrate on the fundamentals – this isn’t just about being bottom up or top down.
To be sure, a secure grasp of the fundamentals is very important – Andrew and Ed clearly set out the value of identifying the companies with the best and most persistent positive earnings revisions. But equally, investors mustn’t miss the bigger picture.
Consider India and Indonesia during the same decade from 2010. Their nominal GDP growth was also very impressive. But while China’s economy featured excess national savings and external surpluses, creating seemingly endless free capital to fund infrastructure, deficits in India and Indonesia left those countries more vulnerable to a stronger US dollar weighing on domestic financial conditions.
This wasn’t just a theoretical risk. Between 2010 and 2019, US dollar earnings per share for the MSCI Indian and Indonesian indices duly fell by 7% and 17%, respectively. This was partly the simple re-denomination of earnings from the local currency. However, the dollar’s strength also led to tighter financial conditions, lower nominal growth and commodity-price deflation. The latter aspect left resource exports stagnant for Indonesia, while India’s banks entered a cycle of bad debt. For both countries, it wasn’t just dollar-denominated earnings that suffered; the compounded annual growth rate for underlying local-currency earnings fell from 18.4% and 32% during 2001-2010 for India and Indonesia respectively to 4.5% and 2.9% during 2010-19.
There’s no recency bias here, either. Indeed, the foundational academic literature on the relationship between economies and markets reinforces the thesis. In 1998, Jeremy Siegel reported that from 1970-1997 the correlation between equity returns and GDP growth was -0.32 for 17 developed markets and -0.03 for 18 emerging markets.1 In 2002, Elroy Dimson and colleagues recorded the correlation between real equity returns and GDP growth as -0.27 from 1900-2000 and -0.03 from 1951-2000 across 16 countries.2
As Professor Jay R. Ritter put it in his own paper: “I am not arguing that economic growth is bad. There is ample evidence that people who live in countries with higher incomes have longer life spans, lower infant mortality, etc. Real wages are higher. But although consumers and workers may benefit from economic growth, the owners of capital do not necessarily benefit. … Furthermore, a country can grow rapidly by applying more capital and labor without the owners of capital earning higher returns.”
Bringing all this together: focusing on GDP trends can lead to the wrong conclusions about the direction of financial markets; understanding earnings is more important for equity investors; but macro factors do influence earnings, the business cycle, risk appetite and more, so cannot be discounted entirely. Amid such complexity, I therefore believe emphasising quality earnings is paramount, while trend following can be helpful as an agnostic return-seeking approach amid turbulence.
Life would be a lot easier for investors if economies and markets were perfectly synchronised. They aren’t, but we needn’t dismiss economics – infamously the dismal science – as a dismal indicator for investors, even when the outlook appears increasingly dismal.
1. Siegel, Jeremy J., 1998. Stocks for the Long Run, Second edition. McGraw-Hill.
2. Dimson, Elroy, Marsh, Paul, Staunton, Mike, 2002. Triumph of the Optimists: 101 Years of Global Investment Returns. Princeton University Press, Princeton.
You are now leaving Man Group’s website
You are leaving Man Group’s website and entering a third-party website that is not controlled, maintained, or monitored by Man Group. Man Group is not responsible for the content or availability of the third-party website. By leaving Man Group’s website, you will be subject to the third-party website’s terms, policies and/or notices, including those related to privacy and security, as applicable.