With contribution from Matthew Isherwood, Senior Quantitative Researcher, Man GLG
Introduction
China is a big part of Asia. But it is not everything. In markets, and in US markets above all, the most crucial lesson from 2020 was a reminder: the stock market is not the economy. Yes, earnings cycles in aggregate move with economic cycles. But index concentration in secular growers and gargantuan price-to-earnings (‘PE’) multiple expansion hammered home the point that the stock market and the economy can have divergent paths, even during a multi-generational recession.
Asian investors have never had the luxury to forget that markets and economies diverge, due to different, more painful dynamics. Asia has boasted extraordinary nominal growth rates over the past 20 years: +13% nominal CAGR from 1999 to 2019, based on the IMF’s series for emerging Asia, versus 5.5% for the world. China’s growth miracle was, of course, an outsized contributor, growing from USD1 trillion to more than USD14 trillion over this period, a compound growth rate of nearly 15%. Still, even the rest of Asia was none too shabby, growing from approximately USD950 billion to USD6.5 trillion, compound growth of almost 2x the world average at nearly 11%.
Figure 1. Emerging Asia GDP
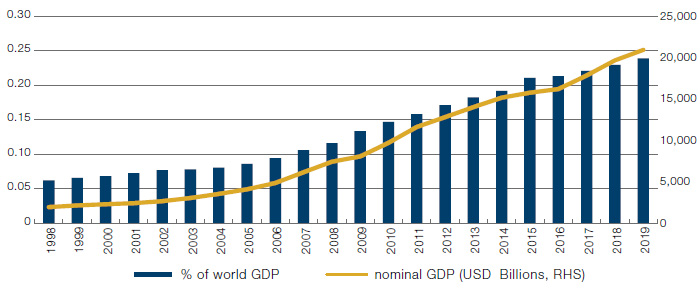
Source: IMF, Man Group; as of 2019.
This is without doubt an economic miracle, but less so for the stock market. Over the 20 years to end 2020, Asia outperformed world equities handsomely, by almost 100%, or 3.4% annualised. But the total return over the period does not tell the whole story: from December 2000 to December 2010, Asia ex-Japan outperformed global equities by 150%, and in the subsequent 10 years, it underperformed by 25%. During this second decade, Asian nominal GDP grew almost 4.5 times quicker than global nominal GDP. Asian economies arrived, but equities absolutely didn’t. What has been going on?
The USD6 Trillion Chinese Elephant in the Room
Everyone with a passing interest in China has a favourite fixed capital formation stat. One of the most eye-catching is that between 2011 and 2013, China consumed more cement than the US did in the entire 20th century, 6.4 gigatons versus 4.4 gigatons. Part of China’s response to the Global Financial Crisis was to materially expand credit provision to state-owned enterprises, with regional administrations incentivised to deliver high nominal GDP and employment growth. The explosion of cement consumption was one outcome of this policy, where real estate development, in particular, grew at astronomical rates. Between 2009 and 2014, floorspace under construction grew by almost 130%, to more than 7 billion square metres, equivalent to five greater Londons. Alongside this, manufacturing capacity in everything grew enormously: for example, steel grew from c800 million tons per annum to almost 1.2 billion tons per annum, and auto manufacturing capacity grew from approximately 15 million light vehicles to almost 37 million.
This boom in fixed capital formation added handsomely to GDP and created a lot of jobs. But, it also resulted in slack in the economy. While capacity utilisation data are scarce, some estimates for the automotive industry suggest that by 2019, capacity utilisation was scarcely over 50%. And what we can see in industrial state-owned enterprises is the impact in aggregate on profit margins, which approximately halved between 2008 and the 2016 deflationary scare trough.
Figure 2. Chinese Industrial SOE Profit Margins
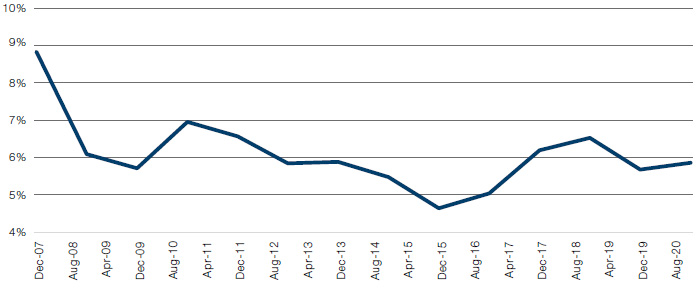
Source: National Bureau of Statistics, Man Group; as of December 2020.
For the China investment tourist, the economic growth rates were tantalising. But the reality is that earnings revisions and investment returns were on a completely different track from the economy, and were, in fact, a victim of runaway capacity growth.
Fast forward to late 2020, and the picture is changing materially. Supply discipline in previously oversupplied industries has rationalised and earnings power has returned in some cases, against a backdrop of slowing headline GDP. Figure 3 shows the annual earnings per share progression and stock price for a leading player in solar glass and associated systems. This company grew its net plant, property and equipment assets five-fold between 2010 and 2015 during a capacity expansion boom. Pre-tax returns on these assets declined from 32.5% to 18%. It was not until industry asset growth slowed and the winners reclaimed pricing power that earnings revisions turned positive, to the enormous benefit of the stock price.
Figure 3. EPS and Stock Price for a Solar Glass Company
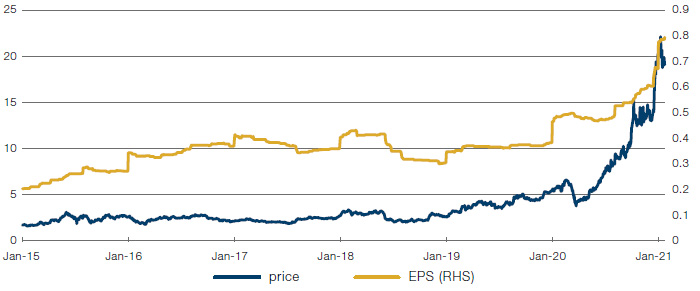
Source: Bloomberg, Man Group; as of 7 January 2021.
South and Southeast Asia’s US Dollar Problem
China is a big part of everything in Asia. But it is not everything. Two of Asia’s other material nominal GDP growth drivers – India and Indonesia – experienced a very different headwind in this post-2010 period, despite spectacular levels of nominal GDP growth. If China’s experience was an exorbitant privilege of excess national savings and external surpluses creating seemingly endless free capital to fund infrastructure, India and Indonesia’s deficits made (and continue to make) them particularly vulnerable to periods of US dollar strength tightening domestic financial conditions.
Earnings per share for MSCI Indian and Indonesian indices in USD between 2010 and 2019 fell by 7% and 17%, respectively. In part, this is just straight translation of earnings from local currency. But the strength of the dollar also tightened financial conditions, reduced nominal growth and deflated commodity prices. In India, this contributed to the emergence of a prolonged bad debt cycle for the banks; and in Indonesia, commodity exports stagnated. In both cases, even underlying local currency earnings were subdued versus the previous decade: growth CAGRs of 4.5% and 2.9% for India and Indonesia respectively for 2010-19, versus 18.4% and 32% for 2001-2010.
Figure 4. MSCI India and Indonesia EPS in US Dollars
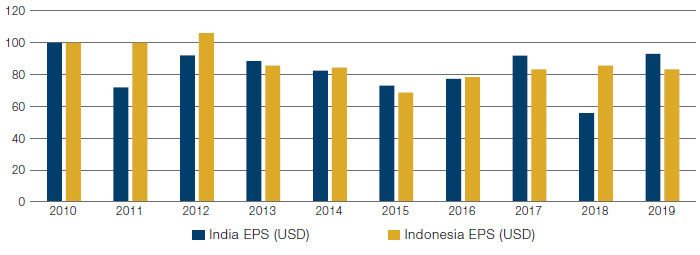
Source: Bloomberg, Man Group; as of December 2019.
Similar dynamics were also at play in the Philippines, Malaysia, Singapore and Thailand. Together, these countries were 28% of MSCI Asia ex-Japan at end-2010, and 22% by the end of 2019.
So What Can You Do About It?
The first thing is to sack your manager who talks up the prospects of an Asian country’s GDP growth. The second is to focus relentlessly on finding the companies with the best and most persistent positive earnings revisions. Principally this is a bottom-up exercise, but it is clear from the explanations above that macro dynamics can have material impacts on earnings developments. Consequently, understanding where earnings revisions are trending by country, sector and factor is crucial. Man GLG’s quant research team has developed some tools to help our discretionary portfolio managers do exactly this, and they add conviction to our fundamental views on the best places to direct research attention.
Notably for Asia, the best quintile of earnings revisions in Indian companies is closing materially versus China. This is consistent with our view that, structurally, India is exiting a long decade of deleveraging and low growth, that a weaker US dollar is loosening financial conditions, that the Covid recovery is lagging China (and will be more full-throated in 2021), and that from the Chinese side, the defensive attributes of mega-cap tech platforms become less desirable when the world is reopening and nominal growth is accelerating. To be clear, earnings revisions are still superior in Chinese companies, but the second derivative is closing in India’s favour. And in markets, second derivatives are important.
Figure 5. Top Quintile of Earnings Revisions, Loading by Country
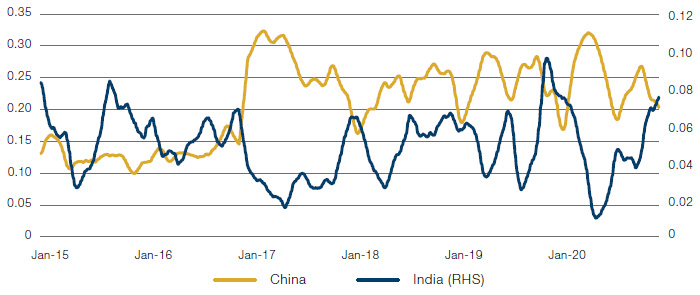
Source: Man Group; as of 11 January 2021.
Similarly, from a factor perspective, the prospect of reopening is seeing the best quintile of revisions shift materially in favour of Value, such that the best quintile of earnings revisions is now loaded more in favour of Value for the first time since 2016. This is a highly significant development which lends fundamental support and momentum to a segment of the market that has been deeply out of favour for several years.
Figure 6. Top Quintile of Earnings Revisions, Loading by Factor
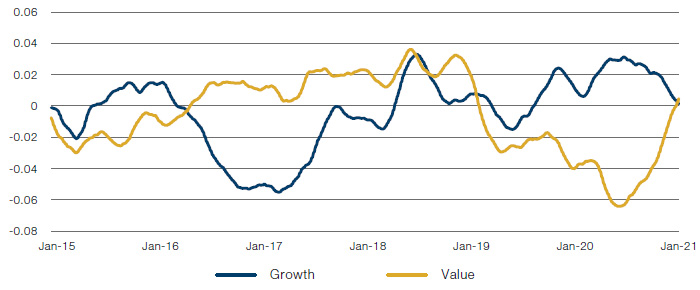
Source: Man Group; as of 8 January 2021.
Conclusion
In conclusion, economic dynamics in Asia provide enormous opportunities to create alpha from stock picking. But it is rarely a function of the level, or even change, of nominal GDP. Macro policies and endogenous conditions have a tangible impact on corporate earnings, and it is understanding where earnings revisions are changing and persisting that is the source to unlocking greater returns over the long run.

You are now leaving Man Group’s website
You are leaving Man Group’s website and entering a third-party website that is not controlled, maintained, or monitored by Man Group. Man Group is not responsible for the content or availability of the third-party website. By leaving Man Group’s website, you will be subject to the third-party website’s terms, policies and/or notices, including those related to privacy and security, as applicable.