Introduction
How does news sentiment towards one company indicate its own market performance? Can news articles be associated with a broader movement on the sentiment and performance of other companies from the same or even different sectors?
The Problem
While there have been studies on the market impact of news sentiment, the analysis has been mostly restricted to the investigation on individual companies.
To the best of our knowledge, there is a lack of studies that combine the study of the correlation of sentiment and the corresponding market movements. While there have been studies on the market impact of news sentiment, the analysis has been mostly restricted to the investigation on individual companies.
This is clearly incomplete: the evolution and collective dynamics of news and sentiment in a network reflecting company relationships can be equally important. Additionally, non-trivial relations may exist between them that go beyond the individual company level.
In this article, we bridge this gap by combining network analysis and natural language processing (‘NLP’) techniques to study sentiment correlation and its associated movements through company networks obtained from financial news data.1
The Method
We applied NLP techniques to understand news sentiment of 87 companies in nine sectors among the most reported on Reuters for a period of seven years from 2007 – amounting to almost 2.2 million sentences across nearly 93,000 news articles.
Interestingly, the chosen period between 2007 and 2013 spans the late stages of pre-crisis boom, the 2008 Recession, the European debt crisis and many important turns of events in the global markets.
We then investigated the propagation of such sentiment in company networks and evaluated the associated market movements in terms of stock price and volatility.
Result 1: Evolution of Sentiment
Figure 1 visualises the evolution of news sentiment of the 87 companies for 27 quarters. Each cell represents the average sentiment of the corresponding company in a specific quarter. Sentiment value is represented using cell colour, with positive sentiment in red and negative sentiment in blue.
We observed that banks in the US (Lehman Brothers, JPMorgan, Goldman Sachs) experienced strong negative sentiment around the financial crisis in September 2008, which indicates that those US banks were significantly affected during the crisis. However, the sentiment of Canadian banks (Bank of Montreal, Royal Bank of Canada) did not suffer as much from the financial crisis, which is in line with the perception at the time.
Additionally, we looked at the average sentiment of each sector for each quarter and found that companies in the technology sector had a relatively stable sentiment distribution along all the quarters, while for those in the financial services sector the distribution was more volatile. Overall, most sectors had negative sentiment in the financial crisis quarters, which clearly reflects the impact of the crisis. Sentiment of the energy and financial services sectors were negative in most quarters, which is consistent with sentiment experienced by individual companies in those sectors.
Figure 1. Sentiment Distribution for Target Companies, 2007-2013
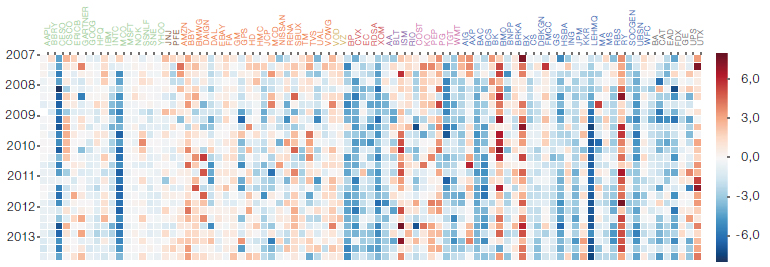
Source: Oxford-Man Institute. For illustrative purposes.
Figure 2. The Evolution of Lehman Brothers’s Position in the Financial News Network Over Time
Source: Gareth Molyneux, Oxford-Man Institute. For illustrative purposes. To see the full animation, please click
Result 2: News Co-Occurrence Network
Co-appearance of companies in the news may reveal the underlying relations between them, thus providing a unique perspective to study such inter-dependencies
The financial market is a system with complex inter-dependencies between companies. Co-appearance of companies in the news may reveal the underlying relations between them, thus providing a unique perspective to study such inter-dependencies. To this end, we constructed a news coverage matrix where each row represents a company and each column represents a news article in the period of study. This co-occurrence matrix is then used to obtain the corresponding network structure.
This revealed interesting information about how groups and sectors differ, specifically:
- While being classified as ‘consumer discretionary’, Amazon has strong links with both technology companies (e.g. Google and Apple) and retail companies (e.g. Walmart), which are nominally classified under ‘consumer staples’. This is reflective of the market position and operating model of Amazon;
- Berkshire Hathaway has interesting links with Proctor & Gamble and Coca-Cola, which could be explained by the large stake Berkshire Hathaway holds for both Proctor & Gamble and Coca-Cola;
- Especially strong links are found between companies that are often direct competitors and/or with considerable overlap in business interests within the same sector, e.g., Vodafone-Verizon and Goldman Sachs-Morgan Stanley.
These findings highlight that the news co-occurrence network may provide additional insight into the relations between the companies, which is not reflected in the sector segmentation. More importantly, because the network can be constructed dynamically, it is capable of capturing the evolution of those relations between companies over time.
Result 3: Sentiment Dynamics in Related Companies
News co-occurrence network may provide additional insight into the relations between the companies, which is not reflected in the sector segmentation.
The inter-dependencies within the financial market may suggest that strong media sentiment towards one company, often caused by a significant real-world event, could have a spillover effect on related companies.
To that end, we first detected days on which there is a significant upward or downward change in the sentiment score of a target company, which we denote as ‘event days’. There are two key rationales why we focus on sentiment events instead of the entire day-by-day sentiment time series: first, by focusing only on the days when there are significant changes in sentiment, we implicitly filter out the noise that is inevitably present in the sentiment time series. Second, sentiment time series especially between related companies can be themselves correlated to some extent, as financial news outlets such as Reuters often simultaneously report on a number of related companies.
We then examined the average sentiment of related companies before and after the event days, where related companies are defined as nearest neighbours of the target company in the news co-occurrence network. It is worth noting that the related companies do not need to experience sentiment events themselves.
We found that there exists a clear positive relationship between the sentiment of the individual company and the group sentiment for several company groups. However, the strength of this relationship varies across groups. For example:
- In financial services, negative sentiment change in one company often correlates with large movement across the group, while positive sentiment does not correlate with statistically significant group movement;
- The same patterns are observed for companies in the technology, industrials and communication sectors;
- For the consumer discretionary and consumer staples sectors, the synchronised group sentiment movements from positive and negative events of individual companies are often more symmetrically felt.
Result 4: Market Movements Associated With Sentiment
For most groups, there exists a clear relation between media sentiment and market performance. Generally speaking, positive sentiment promotes upward price movements whereas negative one promotes price declines and, as a result, both types of events elicit elevation in volatility.
For some company groups, this effect lingers on for a few days. It is, for example, most prominent in the finance sector, which seems to suggest that financial companies are more sensitive to sentiment change, both in terms of the correlated movement in group sentiment and the market reaction.
Limitations of Our Study
First, we only analysed news articles from one particular outlet (i.e. Reuters), which might subject us to hidden biases and scarcity of data. To partially ameliorate the second effect, we limit our focus to the largest companies that receive an adequate amount of coverage from Reuters news. Future work might consider extending the scope by including a broader range of companies and markets.
Second, we were also limited by the present publicly available state-of-the-art NLP analysis on effective entity recognition and sentiment prediction, which remain open research questions in the NLP community. In this aspect, the most obvious next step would be to employ more advanced techniques once they become available, and to use a more domain-specific corpus related to finance jargon, for example, for model training.
Third, in the present work, we focused on the correlation of sentiments and associated market movements based on the historical data. In particular, no analysis of causality has been attempted; nevertheless, we note that, in many cases, the associated market movements took place after the sentiment movements.
Fourth, the current analysis of sentiment effect ignores some of the possible interfering effects. For example, we ignored overlaps of multiple sentiment events from different companies which might be highly related. Future work could seek to rectify this by devising methods to control for such possible interfering effects.
Finally, we acknowledge that, for the ease of analysis and data acquisition, we have only looked at one particular historical period, and we hope to extend the study to a more recent period of time, especially in view of the current market turbulence and the possible changing market landscape in recent years due to increased automation.
Conclusion
Up to this point, analyses of media sentiment and market movements in the existing literature have been largely focused on individual companies or financial assets. In our study, we took into account the dynamic interplay between these companies or assets and a shift from single company to at least sector/group level.
We found that in certain sectors, strong media sentiment towards one company may indicate a significant change in media sentiment towards related companies measured as neighbours in a financial network constructed from news co-occurrence. Furthermore, there exists a weak but statistically significant association between strong media sentiment and abnormal market return as well as volatility. Such an association is more significant at the level of individual companies, but nevertheless remains visible at the level of sectors or groups of companies.
Indeed, better understanding and quantification of sentiment correlation is crucial, and could lead to better financial decision-making at various levels, from market participants to market regulators. Specifically, a deeper understanding of news sentiment and market movement beyond the level of individual companies may help market participants make more informed investment decisions. For market regulators, insights about the collective dynamics of news co-occurrence, media sentiment and associated market movement may provide a more holistic picture of the financial market, and allows for the monitoring of systemic risk in the market as well as designs of effective intervention mechanisms.
To read the full study, click here.
1. In collaboration with Xingchen Wang, Jie Yang, Jan-Peter Calliess and Xiaowen Dong from the Oxford-Man Institute for Quantitative Finance at the University of Oxford.
You are now leaving Man Group’s website
You are leaving Man Group’s website and entering a third-party website that is not controlled, maintained, or monitored by Man Group. Man Group is not responsible for the content or availability of the third-party website. By leaving Man Group’s website, you will be subject to the third-party website’s terms, policies and/or notices, including those related to privacy and security, as applicable.