1. Overview
Imagine that, in 10 years' time, our understanding of natural catastrophes has become so complete that we are able to predict perfectly when, where, and how intense earthquakes and storms will be for the coming year.
Insurance would become rather pointless – the losses for the coming year would be known and this would be equal to the price of cover. The benefit of insurance, and therefore its risk premium, would disappear.
The reality is that we are far away from this target. This necessitates the reinsurance markets, which provide protection against severe, low-probability events such as hurricanes and earthquakes.
In this article we look at various aspects of predictability and randomness in natural catastrophes, and relate them to the most transparent part of the insurance market – catastrophe (‘cat’) bonds.
While predictions are improving, we find numerous examples where the predictive power of large scientific institutions is limited – a consequence of the chaotic nature of the events being modelled.
Therefore, we believe that the most rational way to participate in this market is to focus on diversification across uncorrelated risks rather than a claimed ‘predictive edge’.
2. Probabilities, Predictions and Statistics
A probability is a measure quantifying the likelihood that an event will occur. Claiming a probability to be 1 (or 0) is to claim that an event definitely will (or will not) occur, i.e. it becomes a prediction. A prediction is only valuable if it differs from the consensus probability. For example, there is little value in claiming that there will be an M5.0 (or more) earthquake, or that there will not be an M8.0 (or more) earthquake in the US in 2020, because in the last 50 years, the former has happened every year and the latter has not happened even once.
By contrast, statistics refers to the analysis of past events.
2.1. Predictions of Natural Catastrophes
Hurricane Dorian will be remembered for the death and destruction it caused in the Bahamas in September 2019. At least 50 people died and around 70,000 were made homeless. The severity was such that ‘Dorian’ will no longer be used as a hurricane name going forward.
Towards the end of August, however, insurers were also focussed on the possibility that Florida may take a direct hit, with industry loss scenarios ranging from USD10 billion to above USD25 billion.1
While there is no direct visibility of Industry Loss Warranty (‘ILW’)2 trading, transactions in cat bonds at risk to Florida wind can be seen through the TRACE3 system. How accurate were the forecasts that drove these transactions?
Using the dominant US weather forecasting institute (NOAA/NHC4) forecasts, we have compiled a history of actual positions and 5-day forecasts for Dorian. We postulate that the latter forms the basis for short-term trading decisions - no fund manager can match NOAA in terms of annual budget or facilities, and the forecast is sufficiently far ahead that there is time to form an opinion and execute a trade.
Figure 1. Actual and Forecast Path for Hurricane Dorian
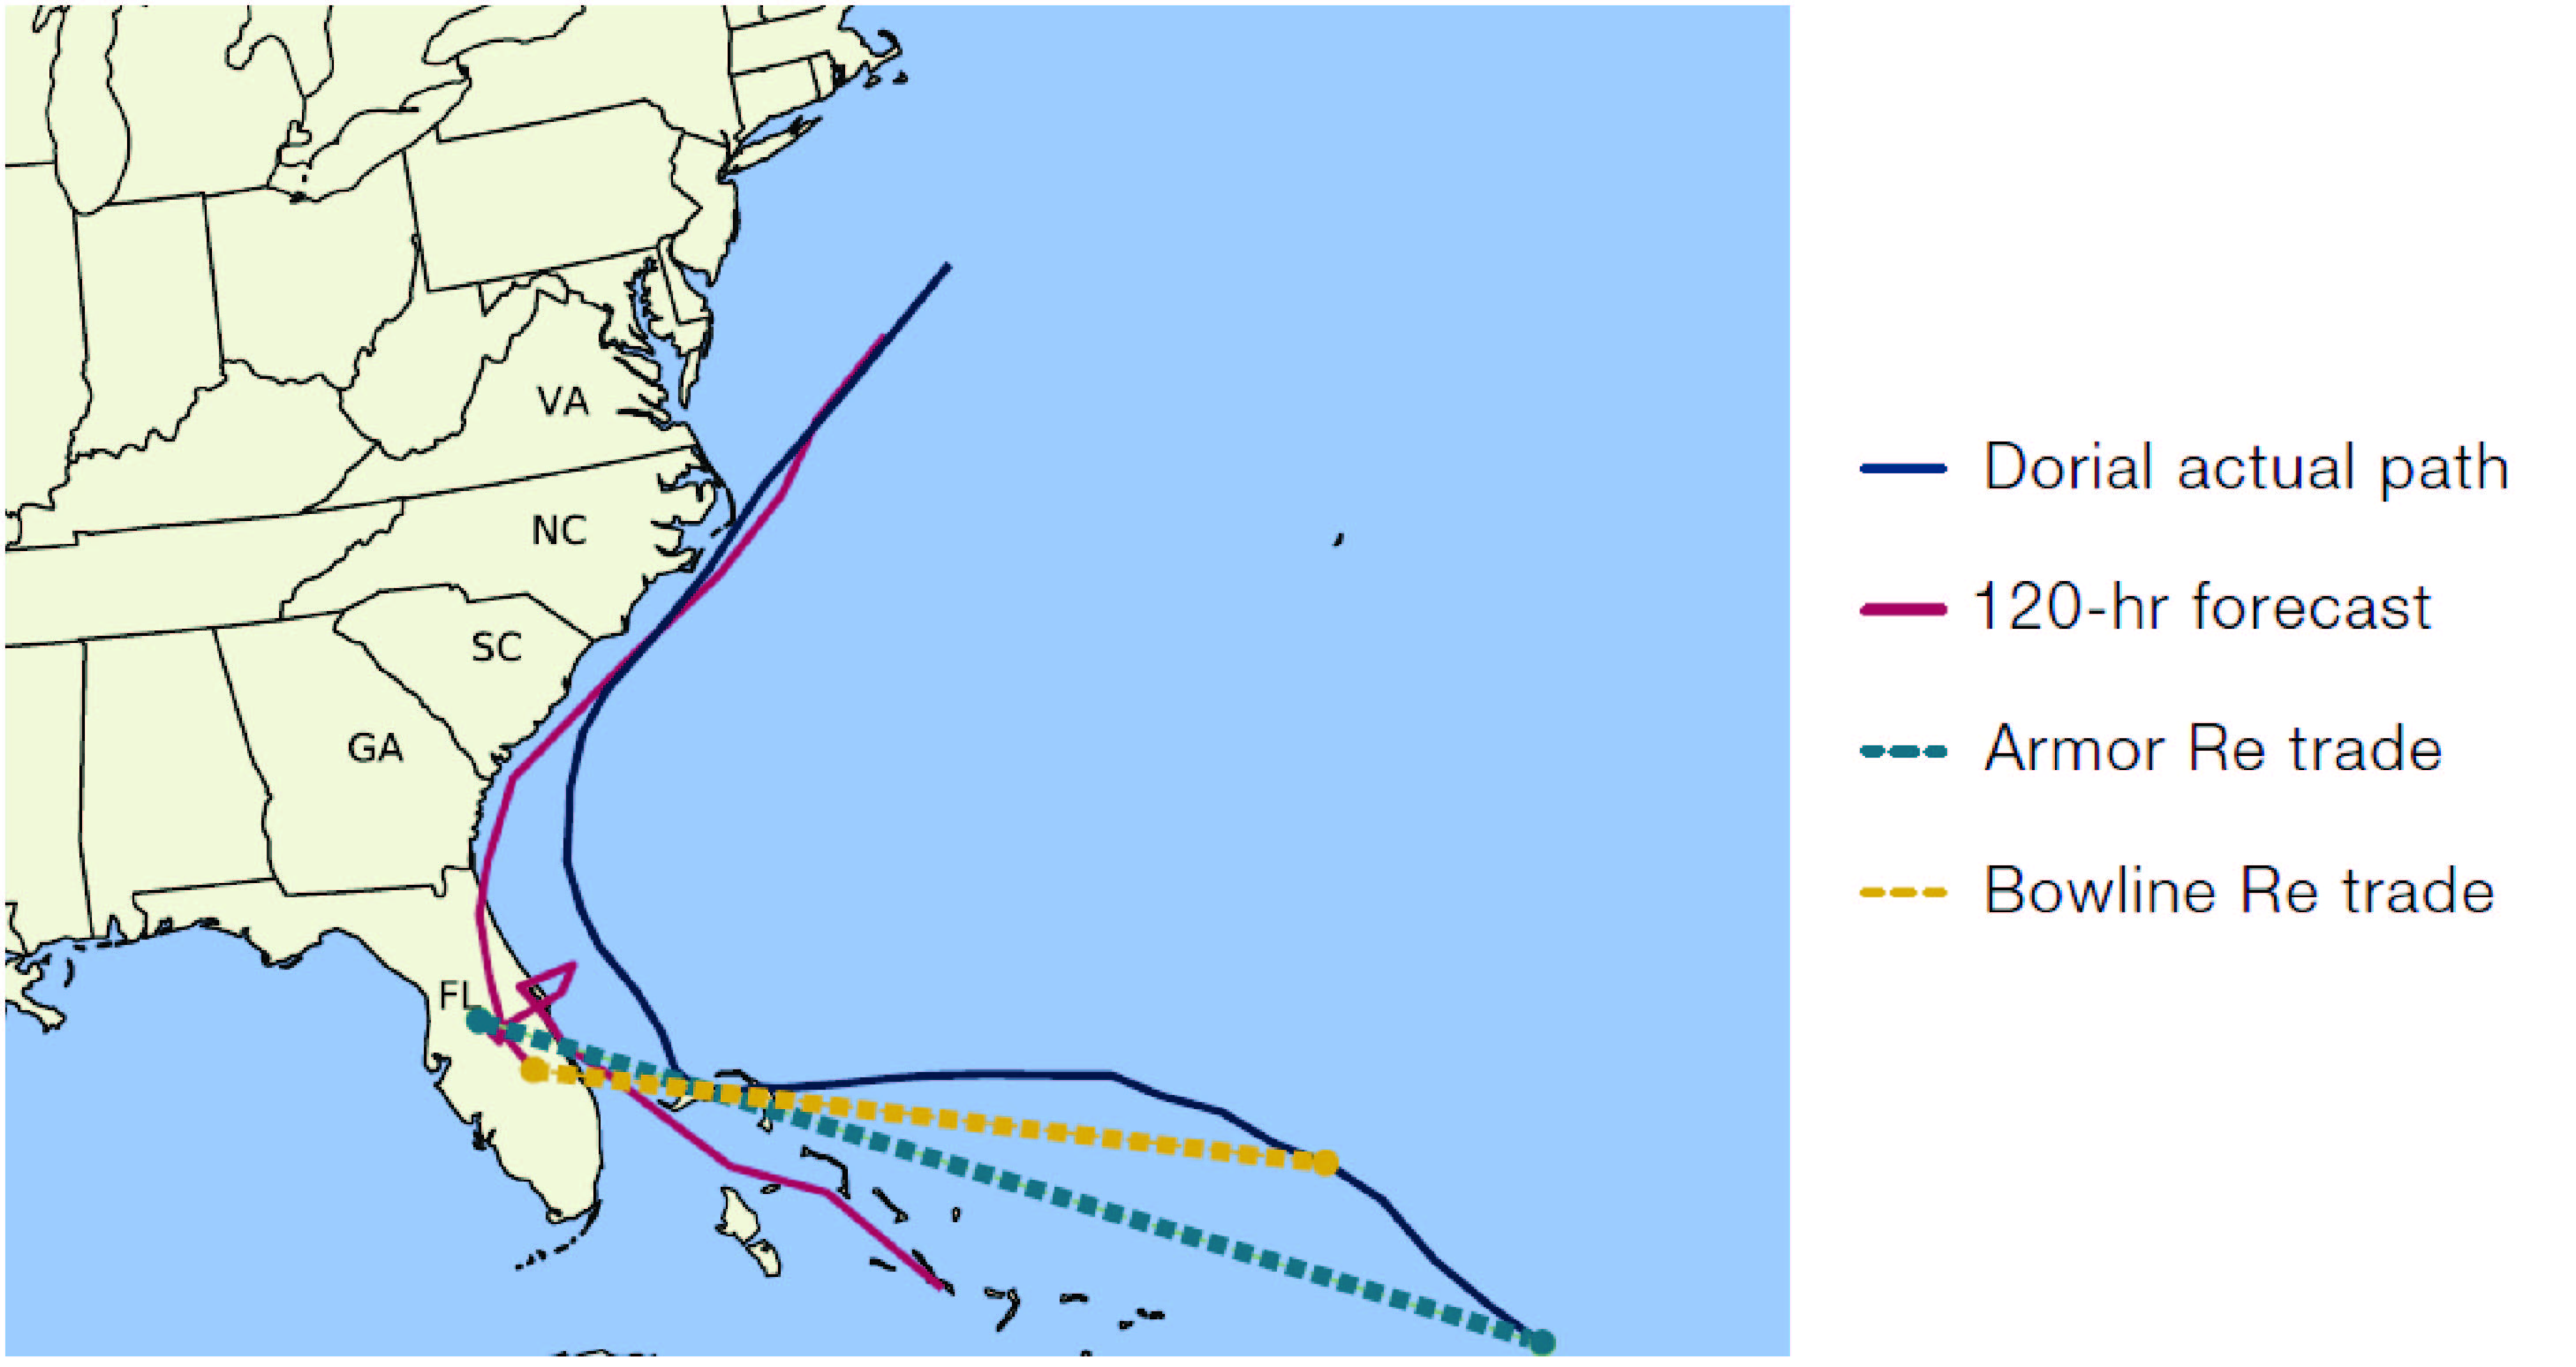
Source: NOAA/NHC, Man Group Database; as of 4 November 2019.
Figure 1 shows the result, and the issue is clear - forecasts had the hurricane penetrating deep into Florida, whereas the hurricane never actually made landfall there. It only made landfall in Cape Hatteras in North Carolina – as a much weakened hurricane.
From TRACE data we can see two cat bond transactions of interest:
- On 29 August, Armor Re II 2018-1 A (the bulk of whose exposure is in Florida storm) traded at 85.50. This compared with broker marks before and after of about 98.50;
- On 30 August, Bowline Re 2019-1 A (the bulk of whose storm risk is in Florida) traded at 94.95. This compared with broker marks before and after of about 99.00.
Figure 1 identifies the actual and forecast position of the hurricane as reported the night before each trade. It seems that these trading decisions were made about the times of the most pessimistic forecasts and represent a material transference of value - around 13% and 4% of principal, respectively. The situation was probably similar with any ILW trades that took place.
In the case of Dorian, the issue is not that the forecasts were less accurate than usual, but rather that a relatively small deviation in track would lead to a large reduction in insured losses. In other words, the forecast insured losses were highly uncertain. It follows that bond bid-offers were likely to be wide. Given that NOAA data is publicly available and therefore there is little information asymmetry, it seems unlikely that such short-term hedging or position taking is likely to be profitable in the long term.
That loss predictions a mere five days ahead were so far from reality illustrates the difficulty of longer range forecasting.
Difficulties in prediction are not confined to the US. Cyclones Lothar and Martin struck Western Europe in December 1999, causing more than EUR14 billion in economic damage (approximately half of which was insured). Amongst other things, they caused the biggest electrical supply disruption ever seen in a developed country (France). One meteorologist later claimed that forecasts could be split into “those that were poor and those that were very poor”. According to risk modeller RMS, just two hours before the storm hit, Paris Météo-France5 was predicting windspeeds of 90-130 kilometres/hour, compared with the 125-175 kilometres/hour actually experienced. Other forecasts predicted Lothar to pass through the UK. It did not.
A second major peril covered by cat bonds is earthquakes. Predicting earthquakes is generally regarded as impossible. The US Geological Survey (‘USGS’) is unequivocal: "Neither the USGS nor any other scientists have ever predicted a major earthquake. We do not know how, and we do not expect to know how any time in the foreseeable future".6 The British Geological Survey’s view is similar: “… there is no reliable method of accurately predicting the time, place and magnitude of an earthquake”.7
2.2. Statistics of Natural Catastrophes
While, as we have seen, making predictions is very difficult, making probabilistic statements is much easier. However, in order to make meaningful statements about probabilities of wind and earthquake events, we need access to historic data.
Through the FDSN8 (an international body encouraging seismograph data sharing) and the USGS, ongoing and historic earthquake data is freely and readily available. Some data goes as far back as the 1630s, and more recent data goes down to negative magnitudes (events too small to be felt by humans).
Similarly, hurricane data is readily available from NOAA, the Japanese Meteorological Agency9 and others. The data includes historic tracks (Atlantic data going back to 1851) and archived forecasts.
To map any results onto cat bond performance, we need the bond offering materials, which we have built up from over a decade of involvement in the market.
While earthquakes can occur anywhere, the distribution of earthquakes throughout the globe is far from uniform - they largely occur at the Earth's plate boundaries. Furthermore, the nature of the boundary guides the likely intensity of the events. A divergent boundary (separating plates) is associated with shallow and lower magnitude earthquakes (and is usually found in oceans). By contrast a convergent boundary, with one plate sliding (subducting) under another, has a tendency to give rise to stronger and deeper earthquakes.
Using publicly available seismic data, we can group earthquakes by depth and intensity then plot their location. The resulting image (Figure 2) illustrates the different boundaries. For example, the South American and African plates are separating through the Atlantic Ocean (shallower earthquakes in yellow or grey); and the Nazca plate is converging with the South American plate on the west coast of South America (deeper earthquakes in blue or red).
Figure 2. Natural Earthquakes 2015-2018, by Depth and Severity
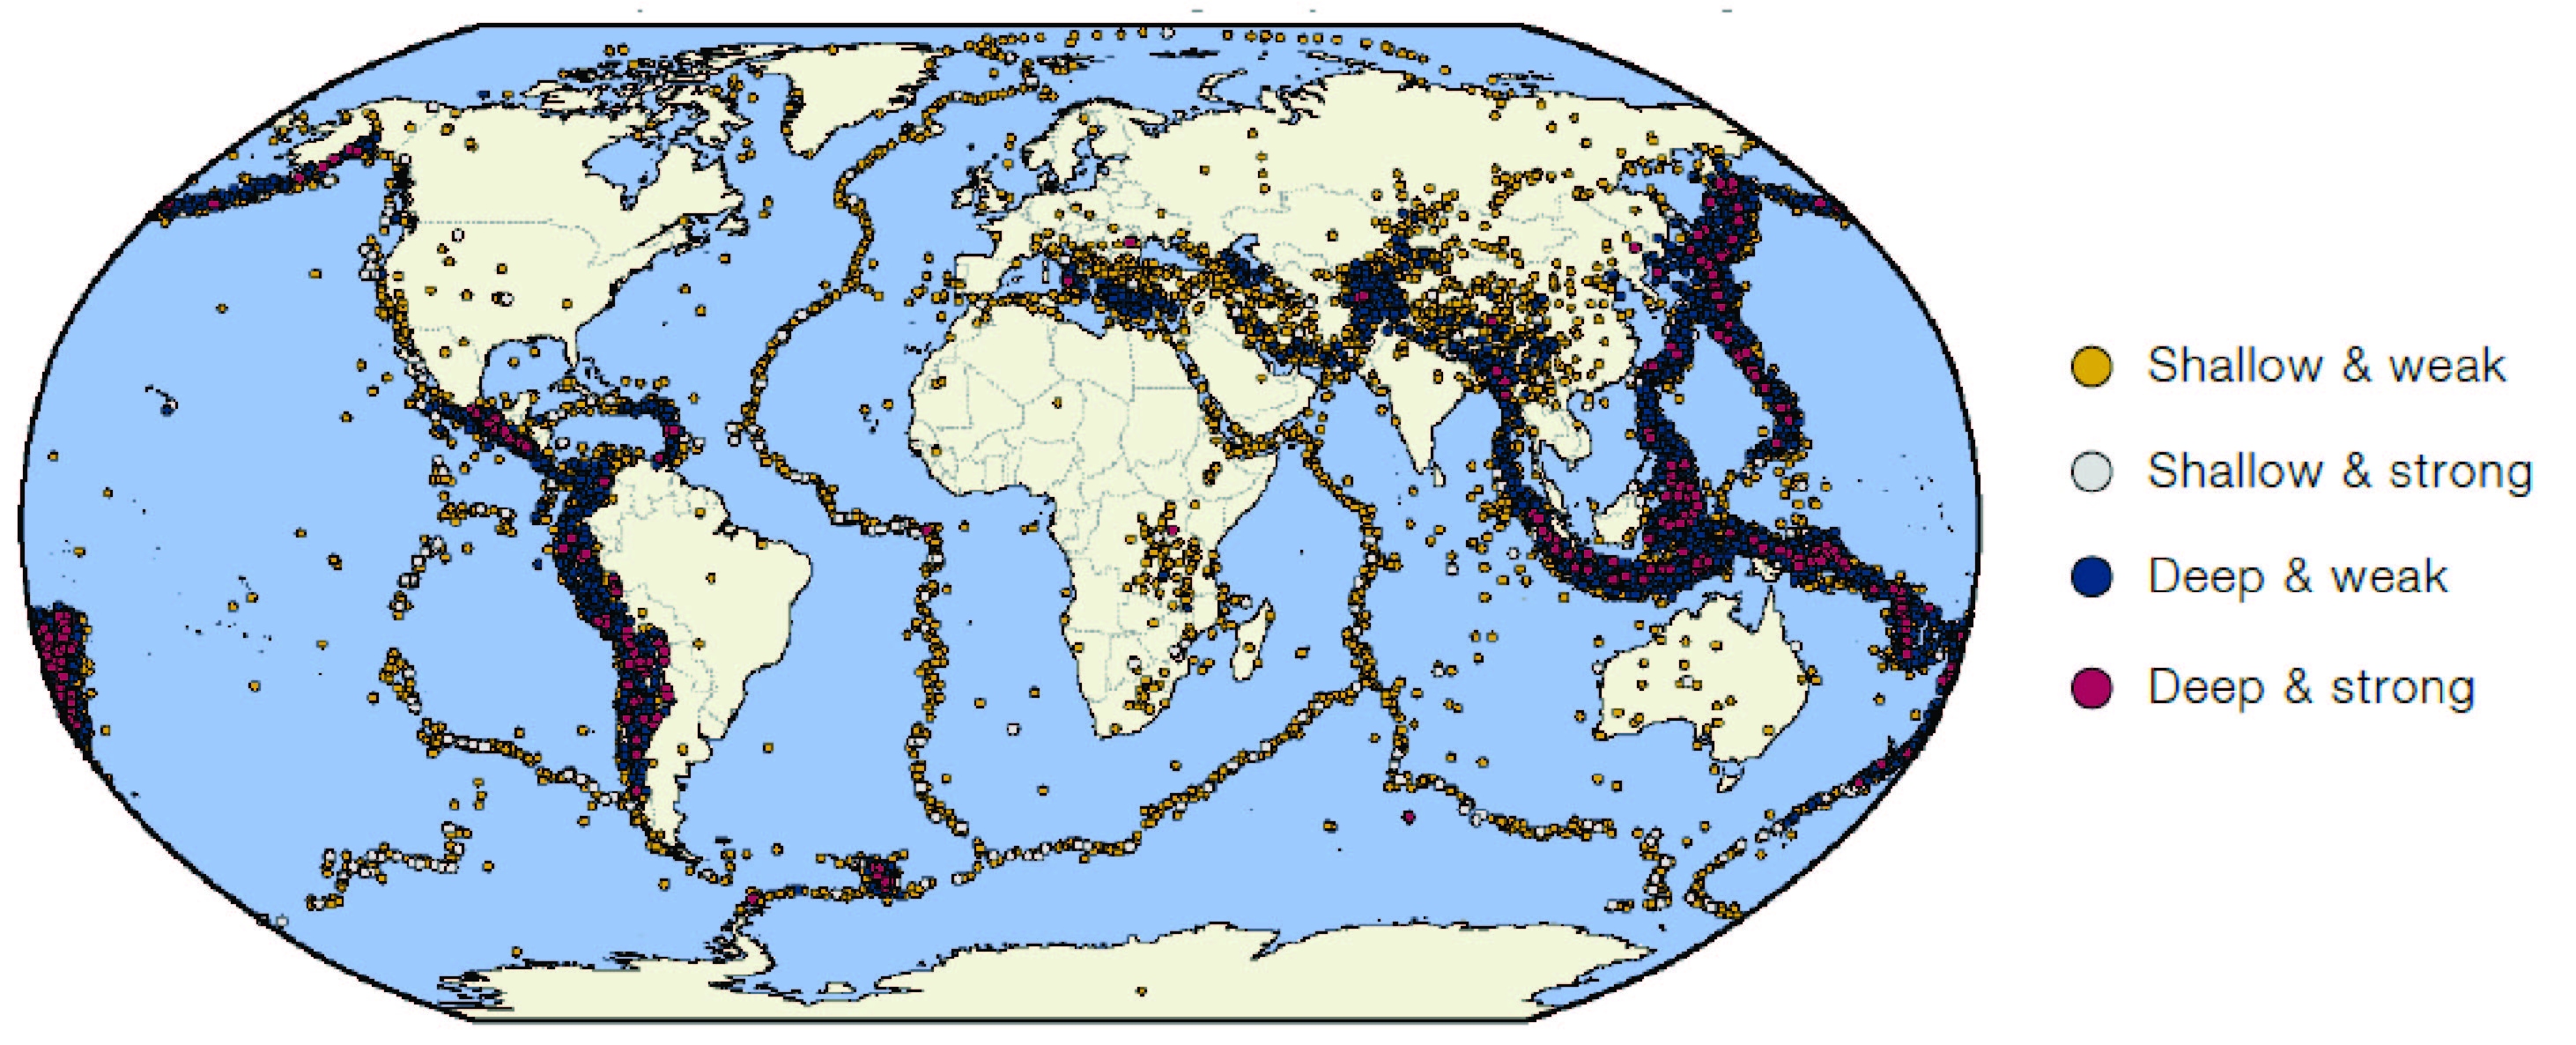
Source: USGS, FDSN, Man Group database; as of 2018.
While earthquakes exhibit no natural seasonality, hurricanes do. In order for a hurricane to form, we need a combination of warm water (at least 26 degrees Celsius) and low wind shear (the difference between wind speed at the base and the top of the hurricane). Both of these vary with the seasons.
Using NOAA historical hurricane data, and identifying the peak wind speed of each hurricane by month, we can calculate the relative frequency of hurricanes by month. We do this by basin (Atlantic and Pacific) and further constrain the data to Category 2 and above; Category 3 and above etc.
Figures 3 and 4 illustrate that the relative likelihood of hurricanes is broadly similar whether we include the less intense and more frequent Category 2 hurricanes or whether we confine the analysis to the fewer and less frequent Category 4 and above. The plots are consistent with the 'official' hurricane seasons being 15 May to 30 November for the Pacific basin and 1 June to 30 November for the Atlantic basin, although storms can exist outside these dates.
Figure 3. Relative Atlantic Hurricane Density by Month
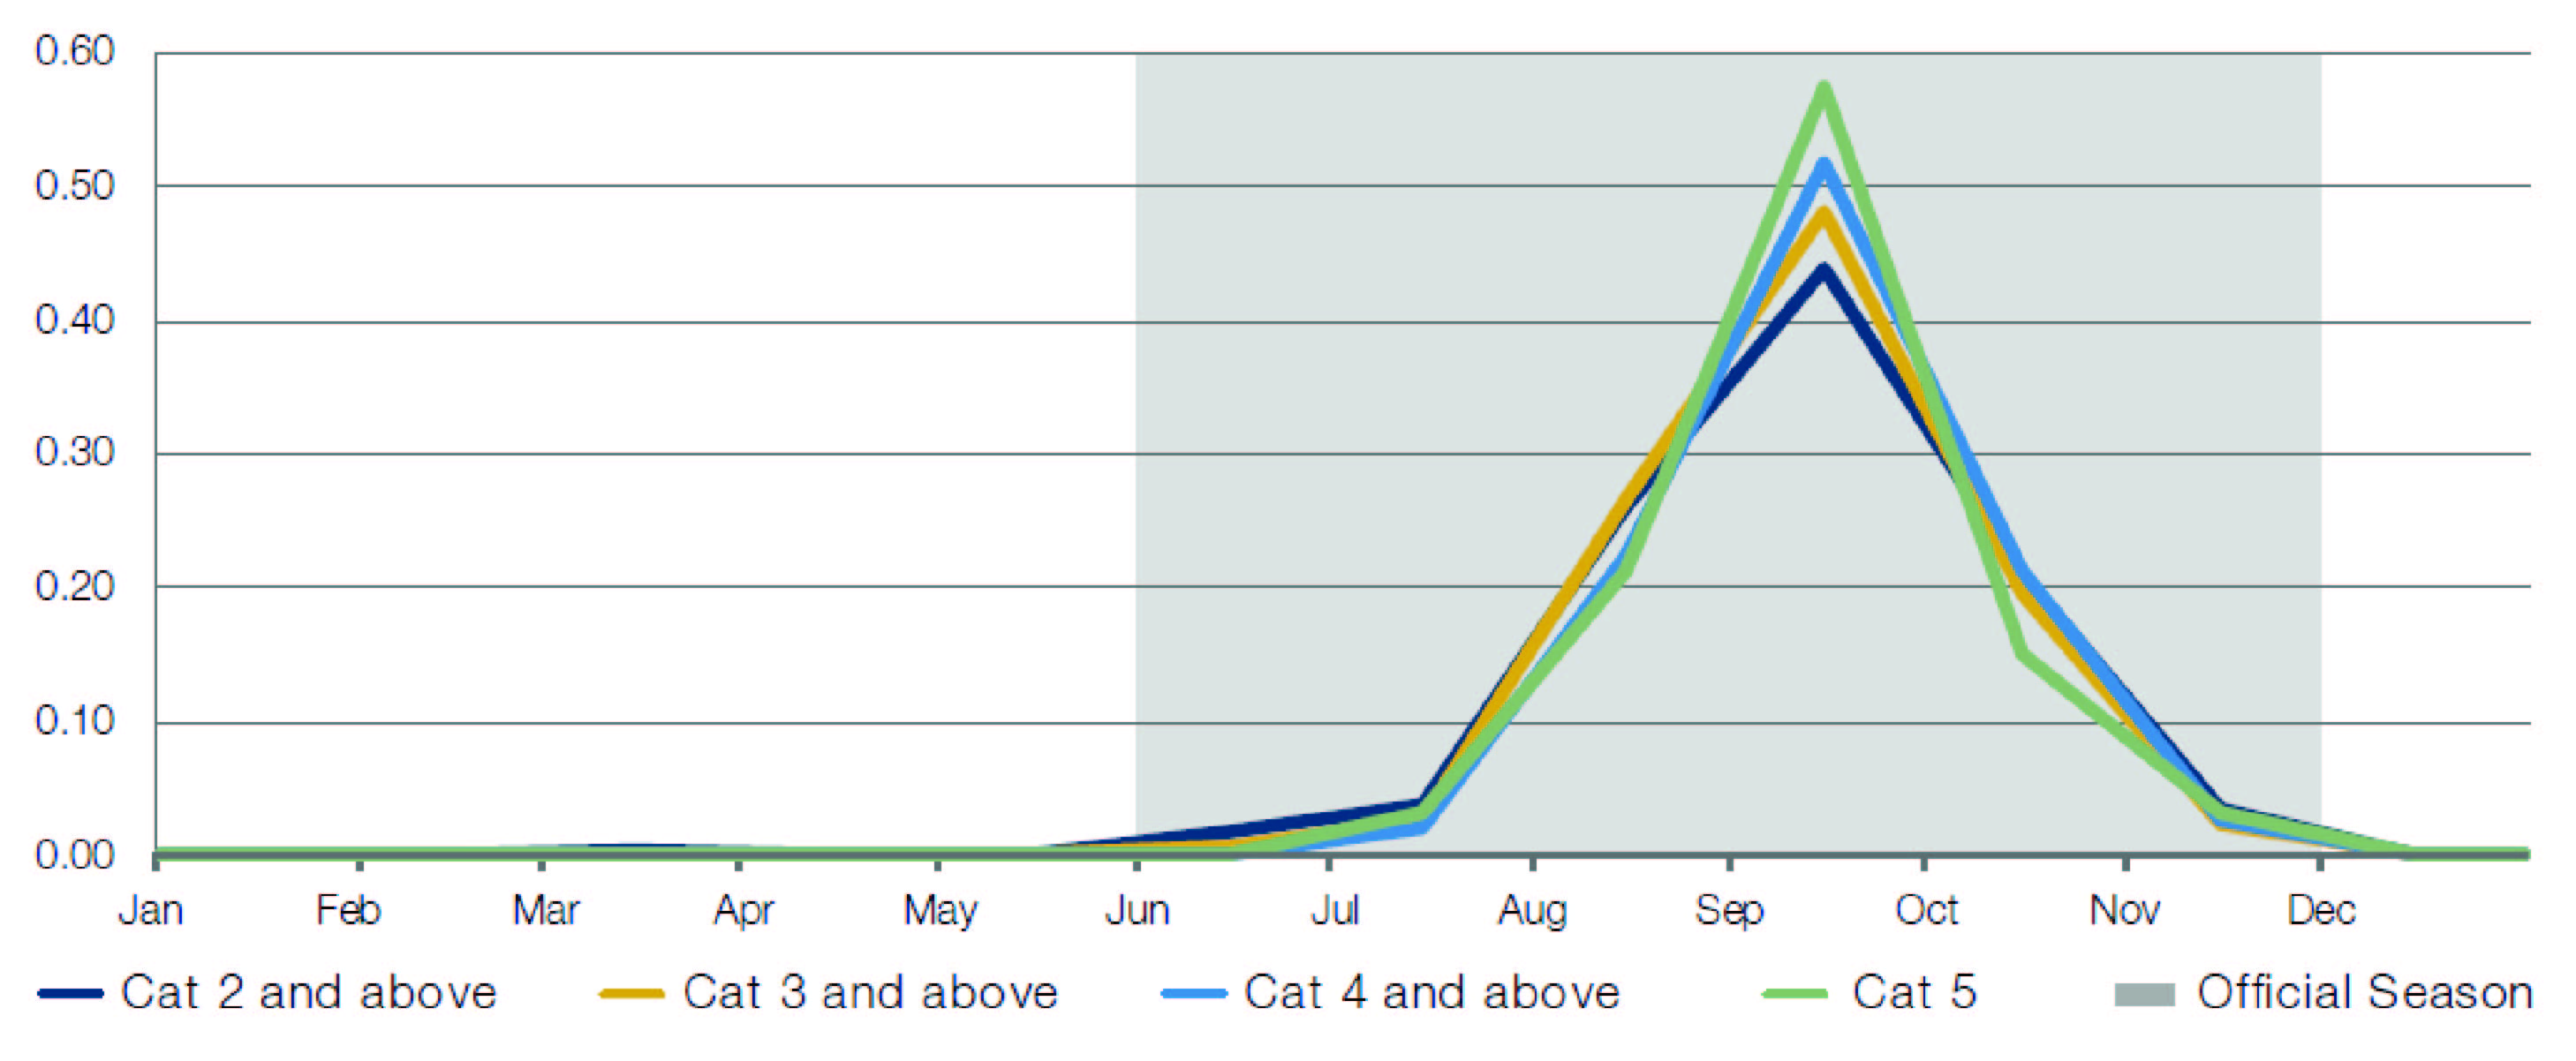
Source: NOAA, Man Group database; as of 3 January 2019.
Figure 4. Relative Pacific Hurricane Density by Month
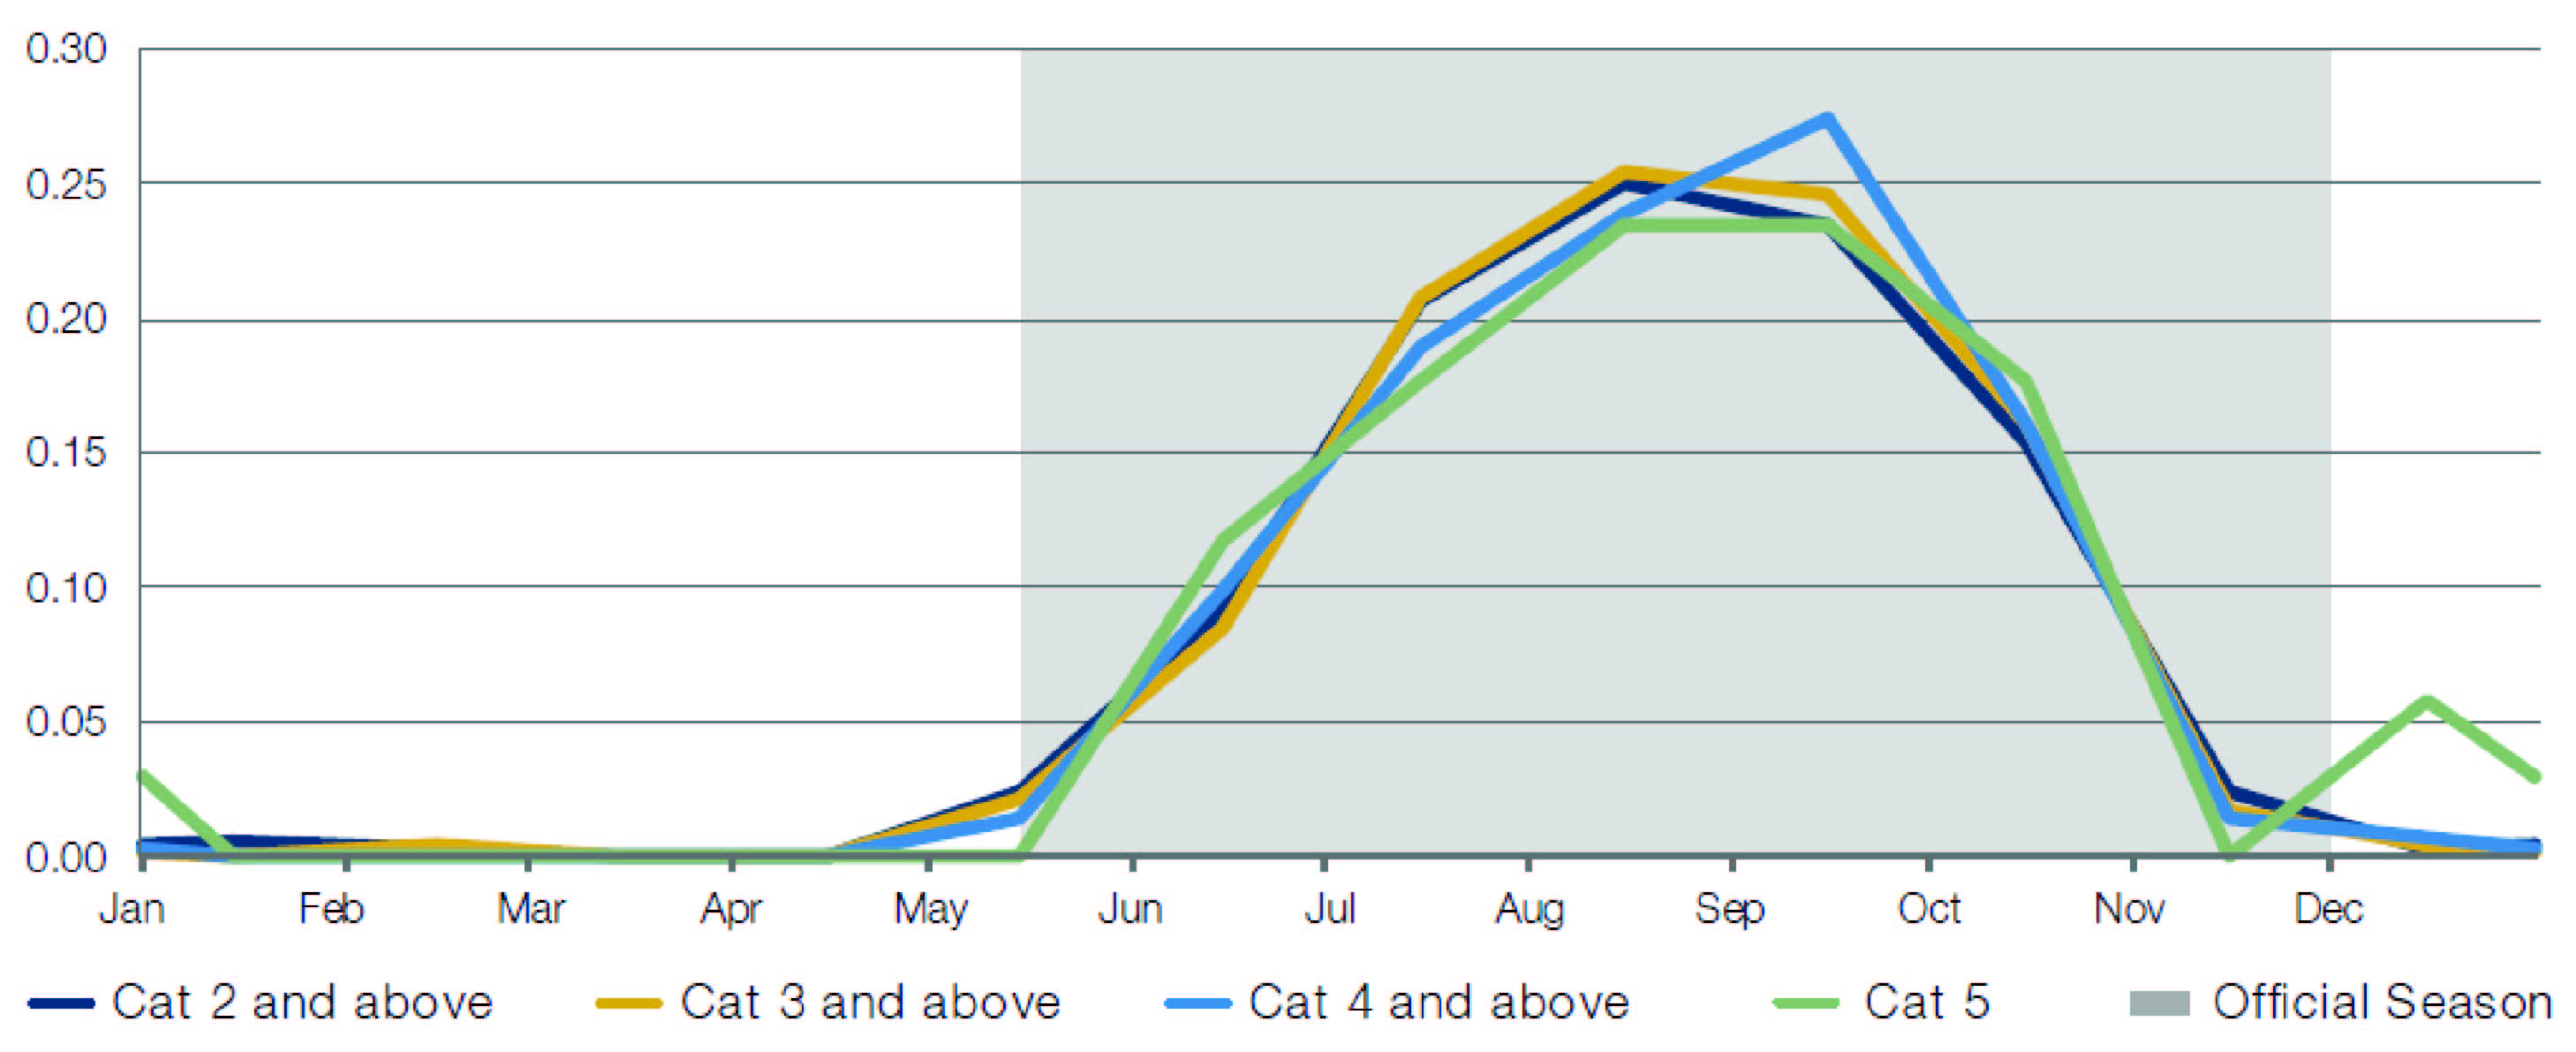
Source: NOAA, Man Group database; as of 3 January 2019.
In addition to annual effects, Pacific wind and water temperature oscillations (known as ENSO, and which occur in 2- to 7-year cycles) also affect hurricane formations through greater or lesser wind shear. El Niño (Equatorial Pacific sea temperatures warmer than normal) favours Pacific hurricane formation and suppresses formation in the Atlantic. The reverse is true during La Niña (temperatures cooler than normal).
The cat bond market is well aware of these cycles. In addition to prices fluctuating with general investor risk appetite and any actual (or expected) impairment of specific bonds, a degree of seasonality will be priced into wind bonds. Specifically, the above-Libor spreads that they pay all year round is partially offset by a decline in the clean price during out of season months. Therefore, during the hurricane season, an investor can earn both the coupon spreads and the balancing price appreciation.
3. Anthropogenic Effects
3.1. Fracking and Nuclear Testing
While earthquakes exhibit no natural seasonality, there are cases where the frequency and intensity of earthquakes has some human dependence.
Figure 5 shows the earthquakes with a magnitude of 3 and above and covering the central US (we have taken a box from 23°N to 51°N and 63°W to 109°W).
Figure 5. Number of Central US Earthquakes by Year
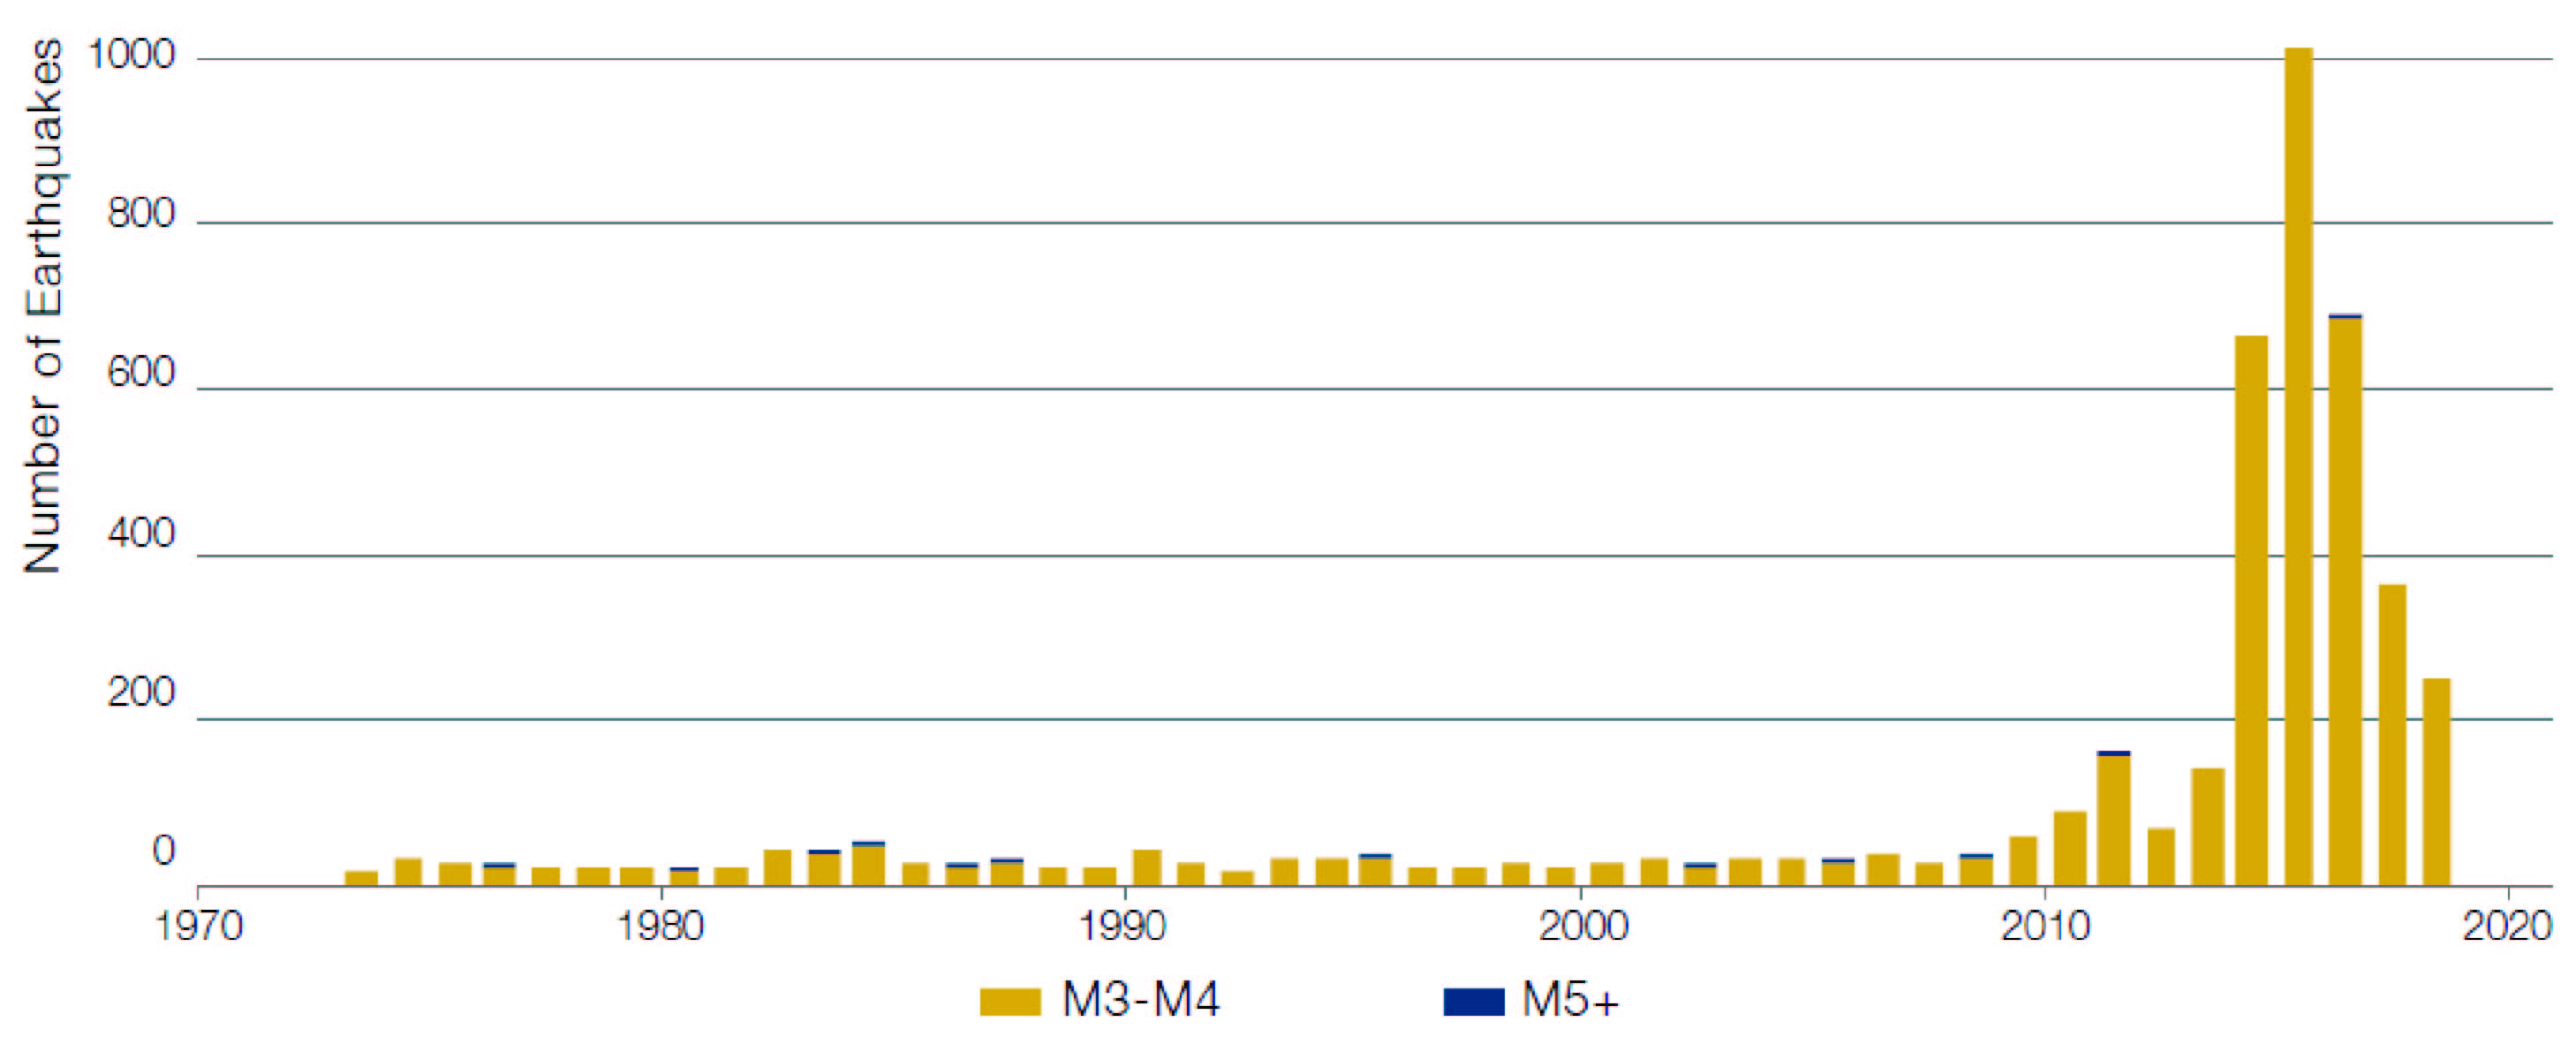
Source: USGS; as of 31 December 2018.
It is striking that between 1973 and 2008, the number of earthquakes of magnitude 3 and above averaged about 27 per year. Between 2009 to 2018 this increased to 350 per year. Furthermore, the latter period experienced annual growth up to just over 1,000 earthquakes per year before declining again.
The increase can be explained by onshore oil production. While the actual fracturing process can induce some earthquakes, the primary causes are the disposal of the fracturing fluid and waste water (as part of oil extraction) in deep wells. Indeed, the latter is produced whether a well has been hydraulically fractured or not. The increase in oil production accounts for the increase in seismic activity, although a shift of extraction to regions where the volume of water extracted is lower has caused a reduction in the seismic activity more recently.
The number of earthquakes in this region with a magnitude of 5 and above remains low (averaging less than one per year in both periods, and with none reaching M6.0).
While human activity such as fracking and nuclear tests have caused earthquakes, these do not have much impact on natural cat bonds. To put the former in context, one cat bond earthquake deal in 2018 had a mere 0.4% of its total exposure to magnitudes below 6.10 In respect of the latter, earthquake insurance risk typically excludes nuclear explosions. Of course, a bond linked to terrorism risk would be expected to have sensitivity to nuclear explosions.
3.2. Climate Change
A hurricane forms when a disturbance over water pulls in warm, moist air which then rises, cools (condensing to form clouds), spreads out and falls. This description evokes circulation looking like a doughnut, but real-life proportions are different – while a hurricane can be 15 kilometres high, its radius can be a few hundred kilometres.
While we do not profess to be experts on the impacts of climate change, the following effects are uncontroversial:
- Average sea levels have been rising for the last century, and the more recent trend is circa 30 centimetres per century. Contributors to this effect include water expansion, ice sheet melting and glacier melting. All other effects being equal, this higher baseline will likely make storm surge more severe (the costs of which are usually borne by wind bonds);
- Rainfall rates are likely to increase, due to increased atmospheric water content, which is clearly negative for flooding exposure;
- While warmer sea surface temperatures increase the likelihood of hurricane formation, vertical wind shear and a warmer upper atmosphere do the opposite. Therefore the likelihood of increased hurricane formation becomes a regional interplay of these effects. A recent NOAA report concluded that for the Atlantic basin, warmer temperatures, increasing shear and a warmer troposphere would lead to a reduced number of storms (but higher rainfall rates);11
- The rainfall experienced from a hurricane is directly proportional to its rainfall rate and inversely proportional to its translation speed. A recent letter to Nature notes a fall in average hurricane speed from 1949-2016 (the effect varying by basin).
The competing effects on hurricane storm formation mean uncertainty in future hurricane numbers. When one considers that wind damage is a nonlinear function of wind speed (the power carried by wind being proportional to the cube of the speed), it follows that peak speeds are drivers of wind damage. Estimating these 'tails' of windspeed distributions introduces even greater uncertainty in predicting the potential damage of a hurricane. Separately, rising sea levels mean that the damage from surge is likely to increase.
4. Implications for Investors
The business rationale for writing insurance is that we are getting paid for loss uncertainty.
As we have shown, it is not feasible to eliminate this uncertainty through perfect foresight:
- Earthquakes cannot be predicted, and loss estimates based on storm forecasts can be materially wrong, sometimes just days ahead of the event;
- In spite of their limitations, publicly available forecasts are likely to be state of the art. These forecasters can have very substantial budgets. For example, NOAA has an annual budget in excess of USD4.5 billion and supercomputers that rank in the top 30 worldwide. Therefore fund managers are highly unlikely to better them, in our view;
- The various aspects of climate change can have opposing effects on hurricane formation, introducing even more uncertainty.
Therefore, if uncertainty cannot be eliminated and informational asymmetry is not a key driver of performance, then remaining areas for offering value to investors include:
- Offering liquidity in times of uncertainty: As a storm nears, any financial instrument bid-offer is likely to be much wider than usual. Some market participants may need to transact, others may choose to do so. However, given the public availability of forecast information, it would seem more rational to be the liquidity provider (i.e. earning the bid-ask spread) rather than paying the bid-offer to monetise some perceived informational advantage;
- Effective management of costs: If insurance-linked instruments are low volatility products with little scope for managers to have a predictive 'edge', then it is important that any strategy is readily scalable and that fund costs are tightly controlled;
- Robust portfolio construction: We believe that this is key. Some perils offer greater reward per unit of risk (for example US wind versus European wind). However, the tail properties of portfolio returns can be improved by diversification across peril, geography, seniority and other factors. The former encourages a concentrated portfolio, whereas the latter encourages a diversified portfolio. Therefore a balance needs to be found between these two competing goals.
2. ILWs are contracts which pay out of if a predefined level of industry loss is breached.
3. TRACE is a system facilitating the mandatory reporting (by broker-dealers who are FINRA members) of secondary market transactions in designated fixed income securities.
4. The National Oceanic and Atmospheric Administration (‘NOAA’) is a US scientific agency whose mission includes the understanding and prediction of changes in climate, weather, oceans and coasts. The National Hurricane Center (‘NHC’) is a division of NOAA responsible for tracking and predicting Atlantic and Pacific weather systems.
5. The French national meteorological service.
6. https://www.usgs.gov/faqs/can-you-predict-earthquakes
7. http://www.earthquakes.bgs.ac.uk/education/faqs/faq19.html
8. International Federation of Digital Seismograph Networks.
9. The Japan Meteorological Agency is responsible for issuing cyclone advisories in the Western Pacific basin.
10. https://www.usgs.gov/faqs/how-large-are-earthquakes-induced-fluid-injection
11. https://www.gfdl.noaa.gov/global-warming-and-hurricanes/
You are now leaving Man Group’s website
You are leaving Man Group’s website and entering a third-party website that is not controlled, maintained, or monitored by Man Group. Man Group is not responsible for the content or availability of the third-party website. By leaving Man Group’s website, you will be subject to the third-party website’s terms, policies and/or notices, including those related to privacy and security, as applicable.