Introduction
In April 2019, we wrote an article entitled ‘The Cavalry Arrives’, in recognition of what is now known as Powell’s pivot. We could have called this current article ‘The Cavalry Charges Through in Large Numbers’ as central banks around the world increased their dovishness, most notably the Federal Reserve and the European Central Bank, in recognition of ever lower inflation expectations.
In isolation, this dovishness is big, bullish news. We are reminded of 1987 and 1998, when central banks cut rates quite late in the cycle, which was followed by very strong markets that turned out to be a long last hurrah in the bull market, in each of these cases, before the classical end of the cycle through overheating and overtightening.
Five Critical Market Debates
Here, we focus on five critical market debates. For readers in a hurry: the answer to each of the five following questions is "no" in our current judgment.
1. Is the current soft patch in nominal growth a harbinger of worse to come?
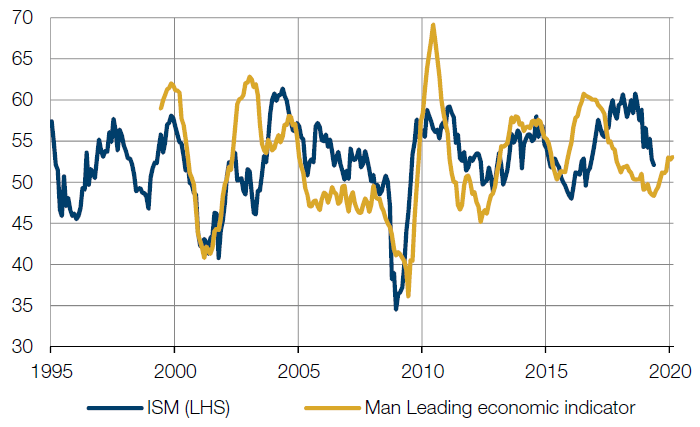
While trade war uncertainties have not helped, we think the current soft patch is a natural result of the tightening in the pipeline from 2018. Tightening is now turning into easing in the pipeline, through lower rates, and lower inflation and input costs. Therefore, we repeat what has been our mantra: we are late-cycle, but not yet end-of-cycle. Our cycle tracker is consistent with this. Meanwhile, our Man Lead Economic Indicator for the US ISM is optimistic on the improvement of growth prospects nine months hence, as measured by US ISM, due to the aforementioned lower input prices and lower rates, amongst others (Figure 1). We do take the inversion of the yield curve seriously, but we note that it has typically occurred 12 months prior to a market peak, and that the important 2-year to 10-year part of the curve has not inverted yet.
Figure 1. Man US Leading Economic Indicator

Source: Man Solutions; partially based on work by Cornerstone Marco; as of 30 June.
2. Will rates go ever lower from here?
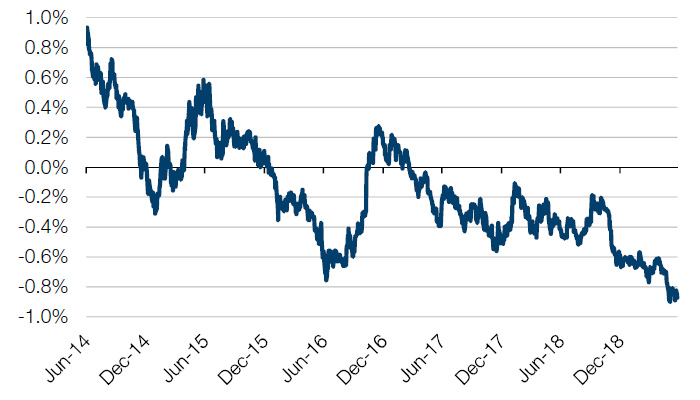
As of 30 June, the Fed is priced for around 100 basis points of cuts in the next 12 months, while the 10-year term premium is the most negative it has ever been on one measure we track,1 indicative of bonds being expensive (Figure 2). We believe that bond prices are too rich versus where we are in the cycle. With US nominal growth about double the current 10-year rate of 2%, the US unemployment rate at well under 4% and weekly unemployment claims close to 50-year lows, it seems unlikely to us that these are attractive levels to put new money to work in fixed income.
Figure 2. Adrian, Crump & Moench 10-Year Treasury Term Premium

Source: Federal Reserve, Bloomberg; as of 30 June.
3. Are equities expensive, after the impressive rally so far this year?
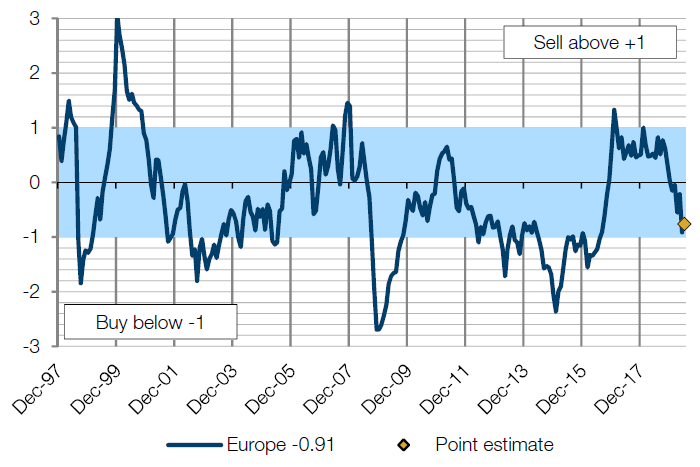
Despite a rise in markets, our models suggest that equities are attractive versus bonds, as the rapidly falling cost of debt has made valuations attractive on our Composite Valuation Indicator (‘CVI’) framework. In Europe, for example, the CVI dropped to -0.9, approaching the -1.0 ‘buy’ threshold, with multiples, cost of debt and inflation all falling (Figure 3). Interestingly, as of 30 June, the MSCI Europe is trading at 126. This is the same level as in February 2017, when the CVI was reading +1 (a ‘sell’ signal). Since that point, however, the price-to-earnings (‘P/E’) ratio has fallen seven points from 22 to 15, inflation has fallen 80 bp from 2.0% to 1.2%, and the 10-year bund yield is off 40 bp from +0.2 to -0.2.
Figure 3. Man DNA Europe CVI Indicator

Source: Man Solutions, Morgan Stanley, MSCI, Bloomberg; as of 30 June.
4. Is the trade war likely to escalate, thus ending the cycle?
With bi-partisan support in the US, and China naturally taking the long view, we believe that the trade and cyber war is here to stay. There is a tangible risk of escalation that ends the cycle. However, while that sounds highly alarming, in our current judgment, this is likely to turn out to be more benign for markets than many currently fear.
First, the analogy with the cold war is informative: it, too, was persistent with two highly committed sides, but while it never went away (until it did), it never blew up either (despite several severe threats), and it would have been wrong to be bearish on markets throughout the cold war just for that reason, and right to fade the extremes. Second, fiscal and monetary policy measures can be taken that help prolong the current economic cycle. And third, an escalation is not in the interest of either side; the US election cycle in particular could ensure that an extreme escalation will be avoided. Having said that, this is a fluid situation that merits tracking closely, and risks are high, not low.
5. Is it time to sell the expensive Quality stocks that have led the market, and buy Value stocks, wholesale, now?
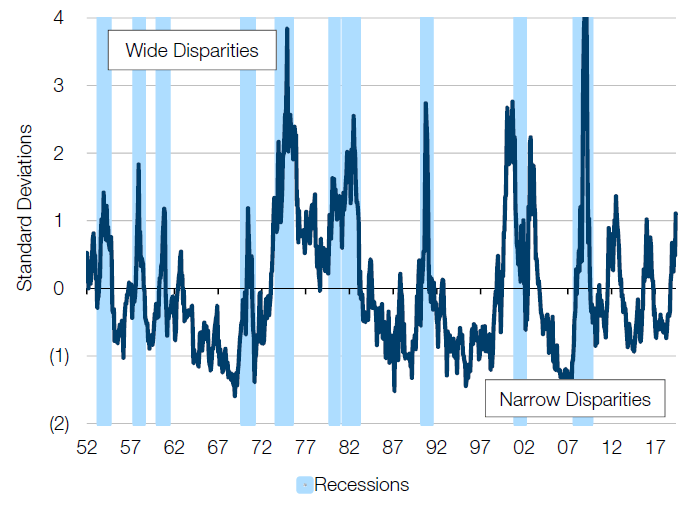
Our experience tells us that leadership rarely changes during a bull market, and can become parabolic at the end of the cycle such as TMT in 1998-2000. However, a cold look at the data demonstrates that the dichotomy between Quality and Value is quite extreme already. For instance, Empirical Research show that European stocks with the highest fundamental stability are the most expensive versus the market, and that the valuation of Value stocks is more than 1 standard deviation extreme in the US (Figure 4). That – combined with our view that nominal global growth prospects are likely to improve, not deteriorate, in the next few quarters – prompts us to take quite a balanced view with respect to Quality versus Value.
However, we stop short of proclaiming this to be the key turning point out of the Quality style, into the Value style, as nominal growth prospects may improve but perhaps not sufficiently to turn the Value / Quality dynamic around completely in a lasting way. We advocate a balanced approach from the current starting point, but a wholesale and lasting rotation into Value is more likely to us after the next bear market, not before.
Figure 4. Valuation Spreads for US Large-Cap Stocks; Top Quintile Versus Market Average (1952-2019)

Source: NBER, Empirical Research; as of 30 June.
1. Adrian, Crump, and Moench 10-Year Treasury Term Premium.
You are now leaving Man Group’s website
You are leaving Man Group’s website and entering a third-party website that is not controlled, maintained, or monitored by Man Group. Man Group is not responsible for the content or availability of the third-party website. By leaving Man Group’s website, you will be subject to the third-party website’s terms, policies and/or notices, including those related to privacy and security, as applicable.