The main story in the first quarter was the pivot from hawkish to dovish. What does this mean for growth?
The main story in the first quarter was the pivot from hawkish to dovish. What does this mean for growth?
April 2019
Introduction
Central banks can act like the cavalry in Westerns. They are powerful and can change the outcome of the battle. The mere threat of their presence is a potent deterrent. But also, sometimes, memorably in the series of Lucky Luke comics, the cavalry can arrive late on the scene when the battle is already over. In the first quarter, the cavalry arrived with much fanfare. Is it late, and does it risk stoking inflation in a late-cycle economy? Or are we still stuck in secular stagnation, making the likely stimulus an appropriate kick-start? For now, markets are benefitting from the very positive impact of the renewed dovishness.
The Dovish Chorus
Indeed, the main story of the first quarter was the Federal Reserve pivot from hawkish to dovish. One of the main drivers of equity markets in 2018 was the tightening by the Fed through higher policy rates and quantitative tightening (‘QT’). If the episode of difficult markets started when Fed Chairman Jerome Powell stated that rates “are a long way from neutral, probably” on 3 October, 2018, followed by a later statement that balance sheet reduction was on auto-pilot, it ended on 4 January, 2019, when he said that he was “listening sensitively to the message that markets are sending” and that the Fed would be “patient” and “prepared to adjust policy quickly and flexibly.”
Other central banks joined the dovish chorus during the first quarter. Bank of Japan Governor Haruhiko Kuroda argued that the BOJ stands ready to do more easing to reach their inflation target, if required. The European Central Bank introduced renewed easing through further forward guidance to keep rates at the current low level through to the end of 2019, while it also announced a third round of Targeted Longer-Term Refinancing Operations (‘TLTROs’), offering cheap 2-year loans to banks, linked to lending activity. In China, there were cuts to the reserve requirement ratio (‘RRR’) and tax cuts, which some seasoned China watchers interpreted as the biggest stimulus effort since 2008 and 2016.
The Dovishness did not Stop There
Not only did central banks become more dovish within their existing framework, there were even voices raised to change the framework of targeting current inflation to a new framework that would allow a period of “make-up” of higher inflation for a while, making up for a previous period of undershooting the inflation target. We look forward to hearing more about this in coming weeks, culminating at a Chicago Fed conference on this very topic in early June.
Finally, further dovishness was provided by politicians talking about Modern Monetary Theory (‘MMT’), which effectively constitutes fiscal spending financed by money printing as opposed to taxes.
So, from a policy perspective, it appears the coast is clear: it will take an extended period of better nominal growth news before central banks embark on tightening again.
What Does This Mean for Growth?
The big question, then, is whether growth will get better or worse. The bull market will truly end when the growth cycle ends, in our view. We are optimistic on global growth. Let us make five points here.
First, we have learned that cycles historically end through overheating and overtightening, and with inflation and rates still low, we judge that moment has not arrived yet. Second, our own lead indicator for the US ISM manufacturing, which correctly predicted slower growth a few quarters ago, is currently showing a stabilisation of the US ISM six to nine months hence, followed by an improvement (Figure 1). Third, believe it or not, the new orders component of the ISM non-manufacturing survey in the US reached a multi-decade high, suggesting the domestic US economy is very strong (Figure 2). Fourth, the China credit impulse, as a result of the easing initiatives, has hooked up. Fifth, fiscal policy in Europe is set to loosen this year. The first quarter certainly saw big earnings downgrades and falls in leading indicators, but we believe markets discount about six to nine months ahead, and started rallying while the downgrades came through.
Figure 1: Man GLG ISM Leading Indicator
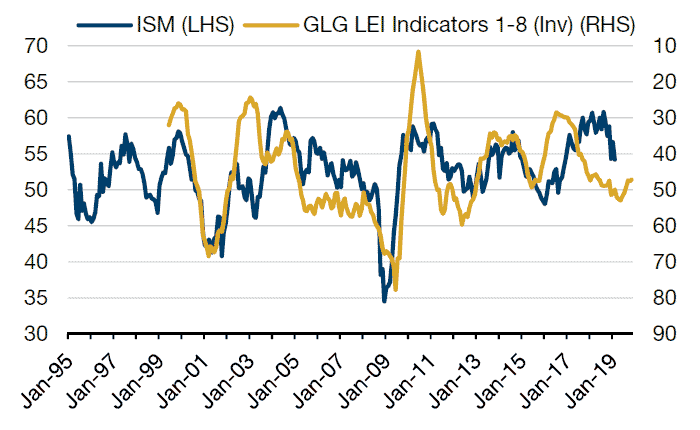
Source: ISM, Bloomberg, Man Group; as of 31 December 2018.
Figure 2: ISM Non-Manufacturing New Orders
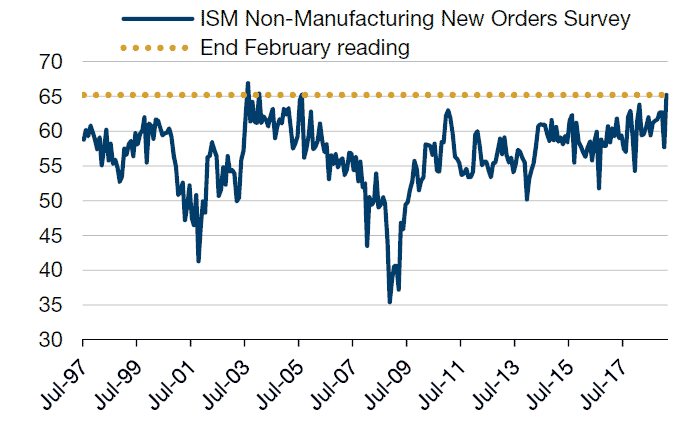
Source: ISM, Bloomberg; as of 31 January 2019.
A final attractive piece of the investment jigsaw is that investors are not overly optimistic, currently. We are wary when everyone is bullish, but excessive bullishness is not an accurate description of the situation today. Take for instance, the aggregate net exposure amongst hedge funds. Throughout the first two months of 2019, we believe this remained very low, as hedge funds in aggregate were not willing to increase their market exposure. Only in recent weeks has this indicator of risk appetite started to rise, but it has not reached the lofty levels that raise concerns with us (Figure 3).
Figure 3: Morgan Stanley Prime Brokerage European Hedge Fund Positioning Net Exposure
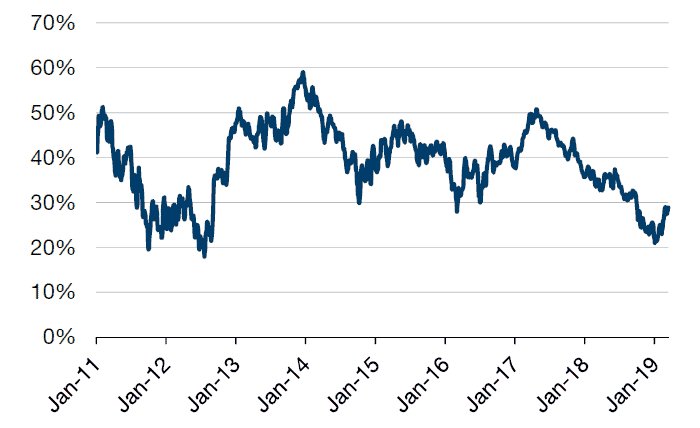
Source: Morgan Stanley; as of 4 March 2019.
Sounds Like Goldilocks?
So, dovish policy, potentially better growth ahead and a relatively cautious investment community – that sounds a lot like Goldilocks!
However, we are not complacent. There are plenty of risks out there. First, we are late cycle, not early cycle. This means that inflationary pressures are building, which could spell the end of the economic cycle, eventually, but we do not see this right now. Second, political risks are very high, with Brexit, trade wars, a looming polarised US presidential election all closely tracked by us. Third, where there is debt there are risks, and we believe China, corporates and Italy are the highest risks.
Fourth, some parts of the US yield curve are inverted, such as the 3-month/10-year part – for the first time since 2007. As Man Group academic advisor Professor Campbell R. Harvey found a few decades ago, if the curve inversion is sustained, it can be an early indicator of a looming recession. We also found, that between the inversion and the end of the bull market, there is typically about 10 months of rising markets left. We take the yield curve inversion very seriously as a potential early indicator of the end of the bull market. However, historically, it has not been an immediate sell signal.
You are now exiting our website
Please be aware that you are now exiting the Man Institute | Man Group website. Links to our social media pages are provided only as a reference and courtesy to our users. Man Institute | Man Group has no control over such pages, does not recommend or endorse any opinions or non-Man Institute | Man Group related information or content of such sites and makes no warranties as to their content. Man Institute | Man Group assumes no liability for non Man Institute | Man Group related information contained in social media pages. Please note that the social media sites may have different terms of use, privacy and/or security policy from Man Institute | Man Group.