ARTICLE | 7 MIN | CREDIT OUTLOOK

Q2 2022: Credit Outlook

April 28, 2022

The fixed income market in the first quarter was characterised by widening spreads, fund outflows and constrained issuance. What are our expectations for the second quarter?

Q1 Recap

Whenever we see outsized moves across markets, we find ourselves constantly searching for historical precedent. And it’s no different now. The current situation provides eerie similarities to the 1970s, when an oil shock heaped additional pressure on an already-elevated inflation backdrop. Instead of an oil crisis, the current exogenous shock has been the war in Ukraine, with a broad range of commodities spiking higher and fanning the inflation flame. The short-term implications are certainly going to crimp consumer disposable income and heap pressure on the margins of companies that are large consumers of commodities. Unfortunately, this is likely to have a disproportionally negative impact on lower-income regions, which will be hit harder by the rise in soft commodity prices such as wheat.

While recent tragic events naturally dominate our thoughts, it is worth remembering that the start of the year was defined by volatility triggered by quantitative tightening signals from a range of central banks. Indeed, rate hikes began well before invasionrelated volatility, with the Bank of England first out of the trap in December 2021. We have seen a number of rate hikes globally and the market is now pricing in more than eight hikes in the US, over five hikes in the UK and even a move closer to 0% in Europe (Figure 1). This led to a very challenging market backdrop for fixed income, with the first quarter seeing one of the worst returns for the Bloomberg Global Aggregate Index since inception (Figure 2).

Figure 1. Market Implied Policy Rates

Problems loading this infographic? - Please click here

Source: Bloomberg; as of 31 March 2022.

Figure 2. Bloomberg Global Aggregate Index Returns

Problems loading this infographic? - Please click here

Source: Bloomberg; as of 31 March 2022.

Tightening financial conditions are probably here to stay, with a number of pressure points reducing consumer disposable incomes – such as higher mortgage and energy rates. The US 30-year mortgage rate recently hit 4.5%, which while low on a long-term basis, is similar to levels that it peaked at during the past Federal Reserve hiking cycle in 2018. All signs are pointing towards a slowing growth environment over the coming quarters, with economists’ expectations being downgraded as we write.

Flows have taken this on the chin, with more than USD62 billion in outflows from fixed income assets globally in the first quarter of 2022 (Figure 3). This represents the largest drop since 2008, when the market experienced more than USD172 billion in outflows. In contrast, equity sentiment remains robust: the ‘buy-the-dip’ mentality is still evident across markets, with c. USD210 billion of inflows over the first quarter.

Figure 3. Global Equity and Bond Flows

Problems loading this infographic? - Please click here

Source: JP Morgan Flows & Liquidity, ICI, EPFR, EFAMA, Bloomberg; as of March 2022.
Note: Flows are from ICI (worldwide data up to Q4 2021). Data since then are a combination of monthly and weekly data from EPFR and ETF flows from Bloomberg. 2022 data as of end March.

Spreads have reacted to the macro and geopolitical backdrop and moved wider across the board (Figure 4). Europe broadly underperformed global markets with all-in spreads in pan-European investment grade (‘IG’) above the third quartile, which has historically been a level that provides investors with adequate compensation for recessionary risk (Figure 5). In developed high yield (‘HY’), spreads have moved in a similar fashion, but remain below third-quartile levels. In fact, they remain below median levels and are expensive in the US. Emerging markets were the weakest performer on the quarter, with Asian HY and EM HY corporate and sovereign bonds selling off due to Chinese real estate and Russian and Ukrainian exposures.

Figure 4a. Total Returns

Problems loading this infographic? - Please click here

Source: Bloomberg, ICE BofAML; as of 31 March 2022.

Figure 4b. Option Adjusted Spreads

Problems loading this infographic? - Please click here

Source: Bloomberg, ICE BofAML; as of 31 March 2022.

Figure 5a. Investment Grade – Historical Spreads
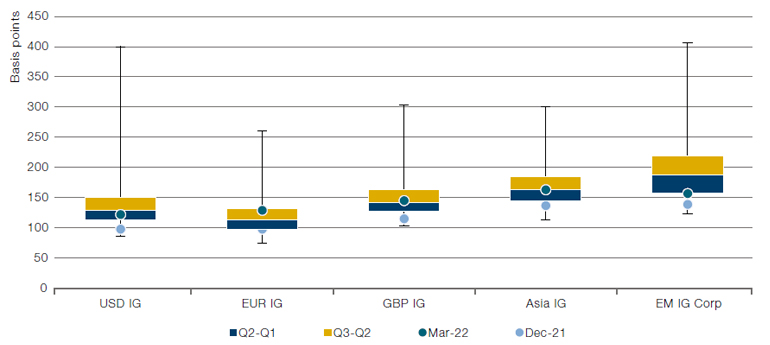
Source: Bloomberg, ICE BofAML; as of 31 March 2022 over the past 10 years.

Figure 5b. High Yield – Historical Spreads
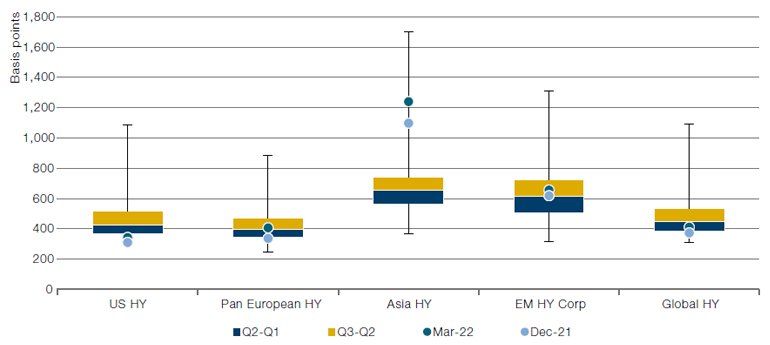
Source: Bloomberg, ICE BofAML; as of 31 March 2022 over the past 10 years.

Credit issuance remains constrained across markets.

Issuance in the US high yield bond market totalled c. USD47 billion and c. EUR10.9 billion in Europe in the first quarter of 2022.1 This compares with USD162.6 billion and EUR41 billion, respectively, in the first quarter of 2021. Convertible bond new issuance came in at USD8 billion in the quarter, the-second weakest first-quarter on record, below only the first quarter of 2009.2 Supply in the emerging-market corporate market was similarly depressed, coming in at USD99.4 billion, with a significant weight in investment grade issues. Indeed, the IG market is the outlier, which continues to remain open (although new issue premiums have remained healthy to encourage buyers).

Q2 Outlook

At Man GLG, we have one overriding principle: we have no house view. As such, portfolio managers are free to execute their strategies as they see fit within pre-agreed risk limits. Keeping that in mind, the outlooks below are from the different credit teams at Man GLG:

We remain more optimistic on the global IG market as the sharp move higher in yields and spreads offers investors better income. This, in turn, could act as protection in case Growth rolls over or if central banks fail to match the level of rate hikes priced by the market. In terms of sectors, we remain positive on energy, European insurers, real estate and alternative financials, while being cautious towards cyclical industrials and consumer cyclicals.
In HY, we have a defensive attitude relative to the overall market, as we believe spreads have yet to price in a potential growth slowdown. We retain a preference for pan-European opportunities and a cautious view on the US (and, in particular, the CCC portion of this market). Our overall outlook favours the health care, TMT and energy credits, while retaining a healthy scepticism of basic materials and commodity consumers, autos and consumer cyclicals.
Convertible bonds delivered negative total returns in the first quarter as the sentiment shift from Growth to Value and the underperformance of a number of expensively priced new issues from 2021 contributed to a shift in valuations to more balanced levels. The broader moves in the convertible bond universe mean that investors are now compensated with a more attractive yields within a low-duration asset class that offers upside participation should we see a continued recovery in equity markets.
In EMD, we maintain a defensive view. The Russia-Ukraine war added new upside risks to the inflation outlook from higher commodity prices and downside risk for growth. Rising global yields, normalisation of international liquidity, slowing growth and de-leveraging of crowded positions in an environment of potential outflows is likely to lead to another leg down on EMD valuations, in our view. In hard currency, rising inflation and lower growth is likely to lead to wider EM spreads, particularly in more vulnerable commodity importing countries. Many frontier countries, some of which were already in a vulnerable position prior to the Russian invasion of Ukraine, are experiencing widening current account and fiscal deficits (given the sharp increase in global food and energy prices) that will be more challenging to finance or refinance given a risk-off environment and continuation of global tightening. In local currency, EM inflation has risen faster than policy rates in most countries, leading to more negative real interest rates now than a year ago. Thus, local EM yields are likely to increase, in our view. Similarly, deteriorating external balances and higher developed-market yields may cause EM currency weakness, despite their already-depressed level by historical standards.

1. Source: Bloomberg; as of 31 March 2022.
2. Source: Bank of America.

For further clarification on the terms which appear here, please visit our Glossary page.

Credit

One platform for public, private and alternative markets

This information is communicated and/or distributed by the relevant Man entity identified below (collectively the "Company") subject to the following conditions and restriction in their respective jurisdictions.

Opinions expressed are those of the author and may not be shared by all personnel of Man Group plc (‘Man’). These opinions are subject to change without notice, are for information purposes only and do not constitute an offer or invitation to make an investment in any financial instrument or in any product to which the Company and/or its affiliates provides investment advisory or any other financial services. Any organisations, financial instrument or products described in this material are mentioned for reference purposes only which should not be considered a recommendation for their purchase or sale. Neither the Company nor the authors shall be liable to any person for any action taken on the basis of the information provided. Some statements contained in this material concerning goals, strategies, outlook or other non-historical matters may be forward-looking statements and are based on current indicators and expectations. These forward-looking statements speak only as of the date on which they are made, and the Company undertakes no obligation to update or revise any forward-looking statements. These forward-looking statements are subject to risks and uncertainties that may cause actual results to differ materially from those contained in the statements. The Company and/or its affiliates may or may not have a position in any financial instrument mentioned and may or may not be actively trading in any such securities. Unless stated otherwise all information is provided by the Company. Past performance is not indicative of future results.

Unless stated otherwise this information is communicated by the relevant entity listed below.

Australia: To the extent this material is distributed in Australia it is communicated by Man Investments Australia Limited ABN 47 002 747 480 AFSL 240581, which is regulated by the Australian Securities & Investments Commission ('ASIC'). This information has been prepared without taking into account anyone’s objectives, financial situation or needs.

Austria/Germany/Liechtenstein: To the extent this material is distributed in Austria, Germany and/or Liechtenstein it is communicated by Man (Europe) AG, which is authorised and regulated by the Liechtenstein Financial Market Authority (FMA). Man (Europe) AG is registered in the Principality of Liechtenstein no. FL-0002.420.371-2. Man (Europe) AG is an associated participant in the investor compensation scheme, which is operated by the Deposit Guarantee and Investor Compensation Foundation PCC (FL-0002.039.614-1) and corresponds with EU law. Further information is available on the Foundation's website under www.eas-liechtenstein.li.

European Economic Area: Unless indicated otherwise this material is communicated in the European Economic Area by Man Asset Management (Ireland) Limited (‘MAMIL’) which is registered in Ireland under company number 250493 and has its registered office at 70 Sir John Rogerson's Quay, Grand Canal Dock, Dublin 2, Ireland. MAMIL is authorised and regulated by the Central Bank of Ireland under number C22513.

Hong Kong SAR: To the extent this material is distributed in Hong Kong SAR, this material is communicated by Man Investments (Hong Kong) Limited and has not been reviewed by the Securities and Futures Commission in Hong Kong.

Japan: To the extent this material is distributed in Japan it is communicated by Man Group Japan Limited, Financial Instruments Business Operator, Director of Kanto Local Finance Bureau (Financial instruments firms) No. 624 for the purpose of providing information on investment strategies, investment services, etc. provided by Man Group, and is not a disclosure document based on laws and regulations. This material can only be communicated only to professional investors (i.e. specific investors or institutional investors as defined under Financial Instruments Exchange Law) who may have sufficient knowledge and experience of related risks.

Switzerland: To the extent this material is made available in Switzerland the communicating entity is:

  • For Clients (as such term is defined in the Swiss Financial Services Act): Man Investments (CH) AG, Huobstrasse 3, 8808 Pfäffikon SZ, Switzerland. Man Investment (CH) AG is regulated by the Swiss Financial Market Supervisory Authority (‘FINMA’); and
  • For Financial Service Providers (as defined in Art. 3 d. of FINSA, which are not Clients): Man Investments AG, Huobstrasse 3, 8808 Pfäffikon SZ, Switzerland, which is regulated by FINMA.

United Kingdom: Unless indicated otherwise this material is communicated in the United Kingdom by Man Solutions Limited ('MSL') which is a private limited company registered in England and Wales under number 3385362. MSL is authorised and regulated by the UK Financial Conduct Authority (the 'FCA') under number 185637 and has its registered office at Riverbank House, 2 Swan Lane, London, EC4R 3AD, United Kingdom.

United States: To the extent this material is distributed in the United States, it is communicated and distributed by Man Investments, Inc. (‘Man Investments’). Man Investments is registered as a broker-dealer with the SEC and is a member of the Financial Industry Regulatory Authority (‘FINRA’). Man Investments is also a member of the Securities Investor Protection Corporation (‘SIPC’). Man Investments is a wholly owned subsidiary of Man Group plc. The registration and memberships described above in no way imply a certain level of skill or expertise or that the SEC, FINRA or the SIPC have endorsed Man Investments. Man Investments Inc, 1345 Avenue of the Americas, 21st Floor, New York, NY 10105.

This material is proprietary information and may not be reproduced or otherwise disseminated in whole or in part without prior written consent. Any data services and information available from public sources used in the creation of this material are believed to be reliable. However accuracy is not warranted or guaranteed. © Man 2025