"All models are wrong, but some are useful."
Introduction
The Composite Market Timing Indicator (‘CMTI’) gives a quantitative indication of the relative merits of buying equities over bonds. The model is a helpful framework for investment thought, in our view; and particularly in the present climate, provides a useful gauge on the whereabouts of the trough.
The CMTI Framework
The framework can be seen to encapsulate the elements illustrated in Figure 1.
Figure 1. CMTI - A Schematic
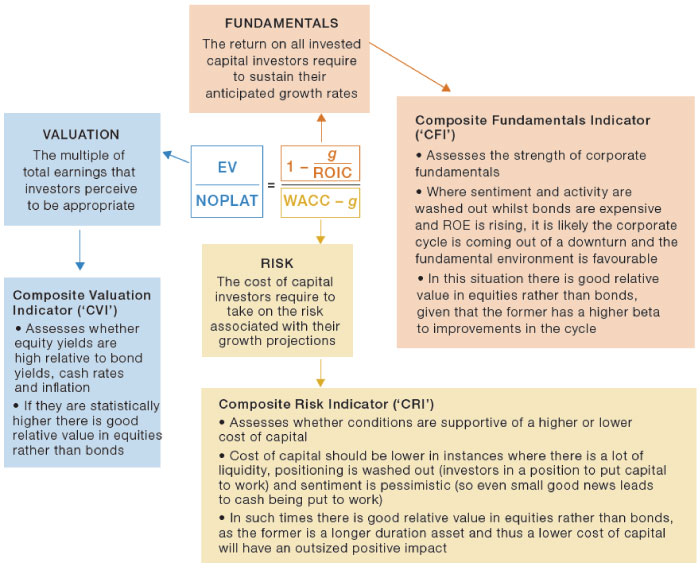
Source: This derives from the following relationships: EV = FCFF / (WACC – g); FCFF = NOPLAT – Net Investment; Net Investment = NOPLAT x Investment Rate.
Figure 1 shows how the three components of the CMTI (CVI, CFI and CRI) are derived. The average of these three metrics is the CMTI. In a vacuum, the three expressions – Valuation, Fundamentals and Risk – will form an equilibrium: an increase in the Valuation multiple that investors are prepared to pay will come either from an improvement in Fundamentals or a decline in the perceived level of Risk.
Of course, that equilibrium can become distorted from reality. It is such instances that the CMTI is designed to signal. For instance, in a situation where relative equity yields are low, corporate fundamentals are topping out and risk is high, the equilibrium allocates away from equities and towards bonds.
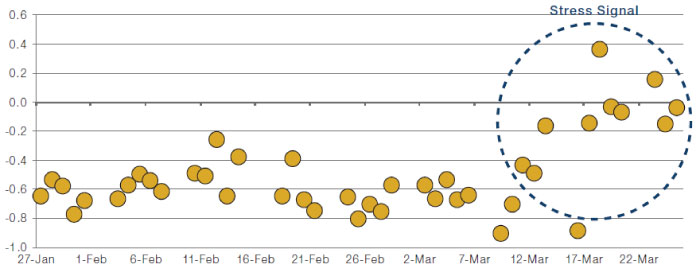
Figure 2 shows the movements of different regional indicators over time. A negative value depicts that it is a good time to buy equities and vice versa. The blue bands at +/- 0.5 show the threshold that has historically been used to demarcate a ‘sell’ and ‘buy’ signal, respectively.
Figure 2. CMTI Movements Over Time
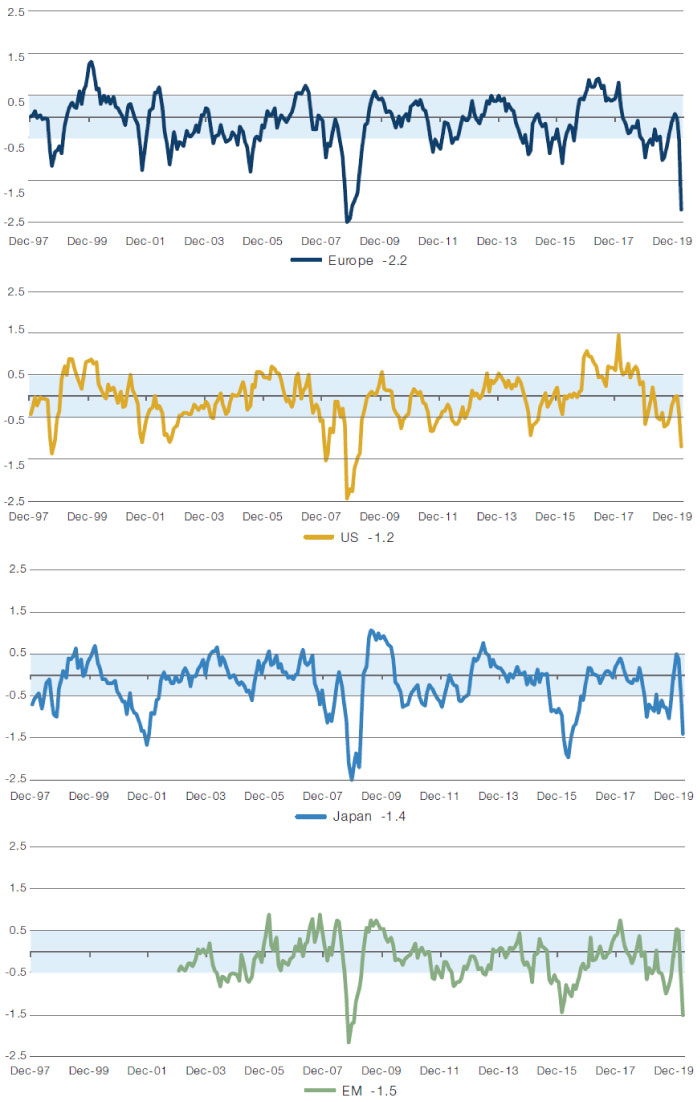
Source: Man Solutions. Last data point is as of 26 March, 2020 and is an intra month estimate. For illustrative purposes only.
The +/- 0.5 bands are, in reality, a guide rather than a rule. We are therefore not overly concerned with day-by-day ticks in the CMTI, and more interested in the pattern of movement.
Following this, in Figure 3, we show the price performance of Europe, US, Japan and EM stock markets, with smoothed buy and sell signals (the green and red dots, respectively). The smoothing depends on the noisiness of the underlying CMTI. In Japan and emerging markets (‘EM’), the model uses 3-month moving averages (‘MMA’). In Europe, the model uses 6MMA and in US, 12MMA. In Japan, the model also makes the ‘buy’ signal less sensitive, lowering the threshold to -1 due to the persistent undervaluation of the market.
We then colour the background according to the last active signal (green for ‘buy’, red for ‘sell’). We have then annotated where the model has been right and wrong.
Figure 3. CMTI Historic Buy and Sell Signals Analysis
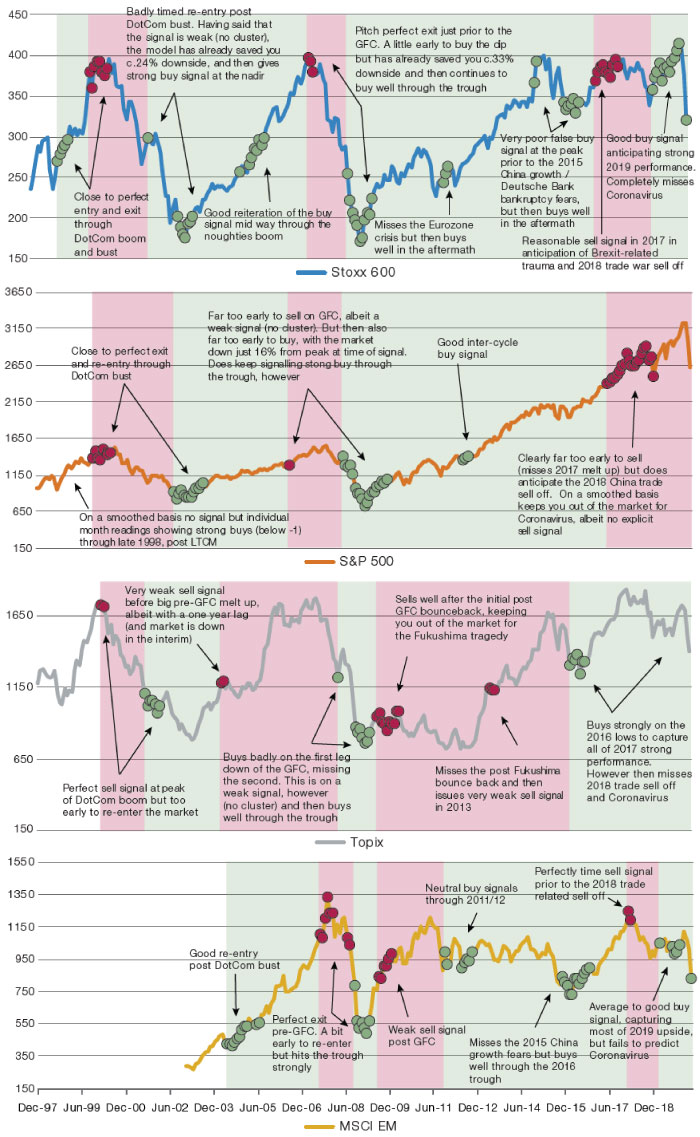
Source: Man DNA team. Past performance not indicative of future results For illustrative purposes only.
CMTI and Qualitative Judgement
We believe that the CMTI should be used in conjunction with qualitative judgement. Put another way, we use the CMTI as a way of assessing what Jesse Livermore referred to as the “basic conditions” of the market1, upon which we add subjective overlay. Coronavirus is a case where idiosyncrasies have overwhelmed basic conditions. In other words, it does not surprise us at all that a bat biting a pangolin in Wuhan, and causing the S&P 500 Index to fall 34%, has been missed by the model.
Having said that, we are equally cognisant that every bear market is unique in some way, and it is an abrogation of responsibility to assign blame to idiosyncratic factors alone. In this instance, whilst the origin of the pandemic was unforecastable, certain fragilities could have been foreseen. Indeed, we have previously noted fragility in what was being priced by US earnings revisions.
The idiosyncratic nature of this sell-off is emphasised in its speed. Figure 4 shows how the ‘Corona crash’ compares to the great bear markets of history. As can be seen, whilst the current plunge is still a long way off the overall magnitude of its predecessors, its speed has been unprecedented. Never has -30% (i.e. 70 index) been breached so quickly.
Figure 4. S&P 500 Index Performance During the Great Bear Markets of History
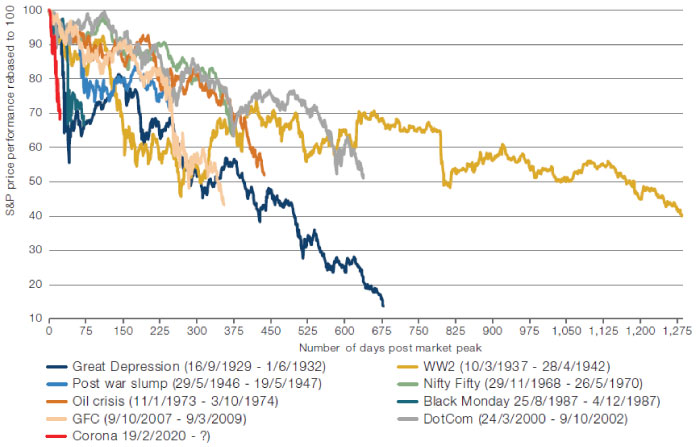
Source: Man Solutions, Bloomberg; as of 26 March 2020.
The sell-off has been unusual not only in its speed, but also in how inter-asset correlations have responded. Indeed, we believe a key metric to watch is the US stock-bond correlation (Figure 5). The bottom line is that when correlations spike, it is a bad sign for equities and particularly for multi-asset portfolios. And that makes the highlighted move a potential signal to cut risk.
Figure 5. US Stock-Bond Correlation
Source: Man DNA team, Bloomberg; as of 26 March. Each dot represents the day-by-day correlation of the 5-minute ticks of the S&P 500 Index and 7- to 10-year USTs.
What About Now?
So much for the history, what about now?
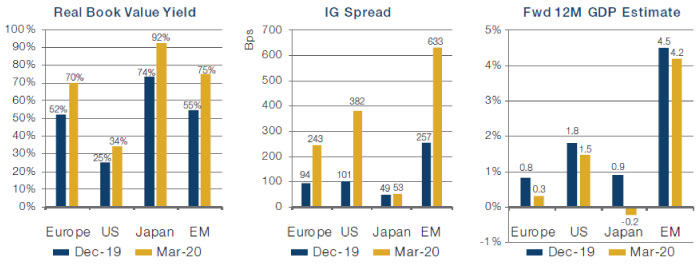
At time of writing on 26 March, the provisional intra-month CMTIs (as per Figure 2) were below -1 in every geography, i.e. double the normal ‘buy’ signal. The ‘buy’ signals were very broad based. In fact, only the Japan CFI (-0.4), the US CRI (0.0) and the EM CVI (-0.2) were above -1. The drivers were myriad, but Figure 6 picks out a few highlights.
Building on that, Figure 7 shows the average returns and hit rates for instances where the CMTI fell below -1 in each geography on a one month basis. The bottom line is, equities at this point have historically given a non-annualised 6-month return of +8% in Europe, +11% in US, +5% in Japan and +22% in emerging markets, with positive hit rates of 71%, 69%, 63% and 78% respectively.
In other words, basic conditions for buying equities look favourable, in our view. As entry points go, this one isn’t half bad.
Figure 6. Selected Drivers of Current CMTI Buy Signal (CVI, CFI and CRI Respectively)
Source: Man Solutions; as of 31 March 2020.
Figure 7. Performance and Hit Rates where CMTI Drops Below -1
| Average equity return next 6M |
Positive hit rate |
|
|---|---|---|
| Europe | 8% | 71% |
| US | 11% | 69% |
| Japan | 5% | 63% |
| EM | 22% | 78% |
Source: Man Solutions; as of 31 March 2020.
1. As per Edwin Lefevre’s Reminiscences of a Stock Market Operator.
You are now leaving Man Group’s website
You are leaving Man Group’s website and entering a third-party website that is not controlled, maintained, or monitored by Man Group. Man Group is not responsible for the content or availability of the third-party website. By leaving Man Group’s website, you will be subject to the third-party website’s terms, policies and/or notices, including those related to privacy and security, as applicable.