In this week’s edition, we discuss why a charging bull of a year will not be handed to investors on a platter, China’s green shoots and equity selling in 2019.
In this week’s edition, we discuss why a charging bull of a year will not be handed to investors on a platter, China’s green shoots and equity selling in 2019.
January 21 2020
Where Will 2020 US Equity Performance Come From?
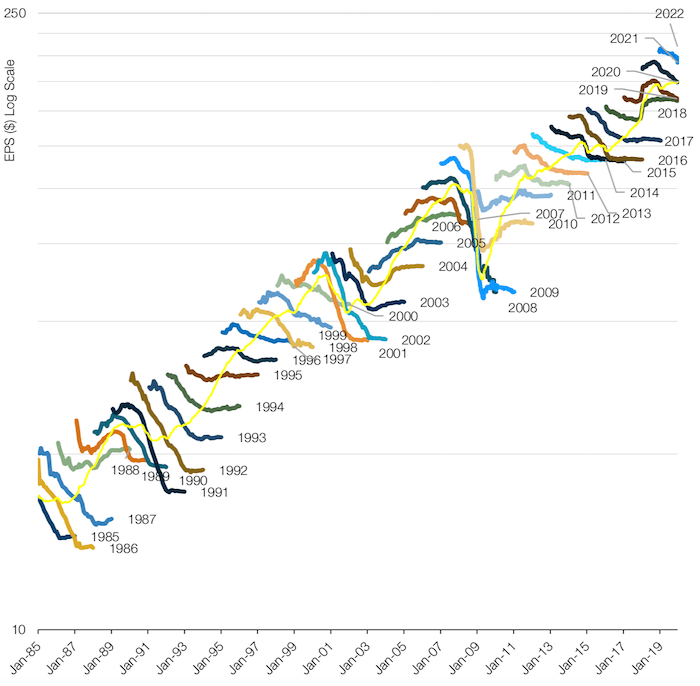
The sell-side is inveterately over-optimistic. Figure 1 shows the Street’s EPS estimate for each discreet calendar year from 1985 to present, for the S&P 500 Index. The yellow line is the linearly interpolated 12-month forward implied estimate. Of the 35 completed years, only three experienced upgrades from start to finish of the estimation period. In 2005 and 2006, China growth surprised to the upside, with consequent revisions in industrials and cap goods. In 2018, broad-based upgrades were required as the Street was wrong-footed by the scale and speed of Donald Trump’s tax cut.
Figure 1. Calendar Year EPS Revisions – S&P 500 Index

Source: IBES, Datastream; As of 1 January, 2020.
As at time of writing1, the blended 12-month forward PE multiple for the S&P 500 is 18.5x. The 2021 EPS integer has already been revised down 6% from $205 to $193. Since 1985, the average (and indeed the median) downgrade has been about 16%. So, if 2021 is an average year estimation wise, by the end of 2020, the 12-month forward EPS will be $172. The multiple is now slightly above the end-2017 high; and by most valuation metrics, the US has never been more expensive outside of the DotCom boom. So, assuming we don’t get any multiple expansion, then an average year for fundamentals will lead to a flat-to-marginally down year for US equities, at a point where we are already just shy of +3%.
Now with the PMI, industrial production and the geopolitical environment coming off the lows, there is certainly potential for a more muted-than-average downgrade. However, investors should be aware that another charging bull of a year will not be handed to them on a platter. The politicians, we’re sure, will be all too aware.
China’s Green Shoots
At this time last year, consensus was of the view that China would be the one region that would surprise on the upside. What a difference a year makes!
While consensus may not be as optimistic this year, we believe that we are starting to see the green shoots of an economic recovery in China: steel and aircon production is on the rise; aircon production can be thought of as an indicator of housing construction. Diesel consumption, and railway and air freight are also on the up. Finally, not only are copper imports into China increasing, but also Asian imports to China (Figure 2).
Problems loading this infographic? - Please click here
As of 31 December 2019. Numbers are 3-month moving averages; units are in millions except for CNFIRMP, which is in billions
Investors Are Selling the Equity Rally
Equity selling (nominally) in 2019 has been larger than either 2008 or 2018. As Figure 3 shows, flows to money market funds had been very healthy last year due to outflows from equities and competitive interest rates relative to recent history, while flows into municipal bonds in 2019 were the largest since at least 2006.
Indeed, it will be interesting to see if the recent Federal Reserve rate cuts dampen appetite for money market funds.
Problems loading this infographic? - Please click here
Source: Investment Company Institute; as of 31 December 2019.
With contributions from: Henry Neville (Man Solutions, Analyst), Ed Cole (Man GLG, Managing Director – Equities), Dan Taylor (Man Numeric, CIO), Hang Yang (Man Numeric, Analyst) and David Yang (Man Numeric, Analyst).
1. As of 17 January 2020.
You are now exiting our website
Please be aware that you are now exiting the Man Institute | Man Group website. Links to our social media pages are provided only as a reference and courtesy to our users. Man Institute | Man Group has no control over such pages, does not recommend or endorse any opinions or non-Man Institute | Man Group related information or content of such sites and makes no warranties as to their content. Man Institute | Man Group assumes no liability for non Man Institute | Man Group related information contained in social media pages. Please note that the social media sites may have different terms of use, privacy and/or security policy from Man Institute | Man Group.