Introduction
Superlatives are the norm, and nothing is average this year.
This was the quickest bear market ever: it took only 22 days to reach the 20%+ correction threshold, the most synchronous global recession ever due to the self-imposed medicine; and the biggest recession in modern times at -10% GDP in the US versus only -4% during the Global Financial Crisis (‘GFC’). Subsequently, the biggest policy stimulus ever has led to the quickest market recovery ever.
And now, after all that, we are here – see Figure 1. Some markets are back at their highs, such as the Nasdaq, and others much closer to where they were at the March market low, such as US 10-year bond yields. Remarkably, investor sentiment as measured by AAII1 bulls minus bears is still within a whisker of its 2020 low point.
Figure 1. Year-to-Date Market Ranges
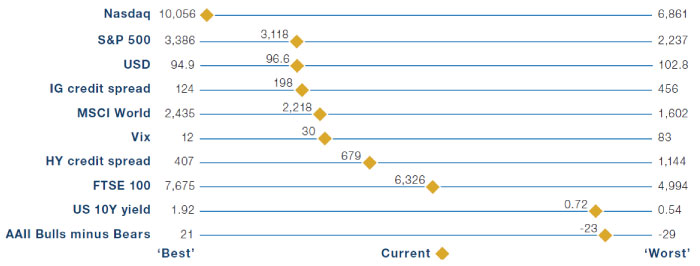
Source: Bloomberg; as of 25 June 2020.
Where Do We Go From Here?
To cut to the chase, we conclude that the balance of factors is positive for risky assets on a 1-year+ view, with some serious question marks over the shorter-term.
First and foremost, taking the long view, equity bull markets start in the depth of one recession, and run all the way to the next recession. This recession is likely to have ended in the second quarter, in our view, witnessed by the US monthly payrolls, the gradual end of lockdowns in major economies and our expectation that full lockdown will not be implemented anymore. The past five US economic expansions lasted eight years on average, according to Evercore ISI. Therefore, from that perspective, the bull market has only just started. Indeed, lead indicators have bottomed and are expected to continue to rise from here, as per our lead indicator of lead indicators, for instance, which is firmly pointing upwards (Figure 2).
Figure 2. US Leading Economic Indicator
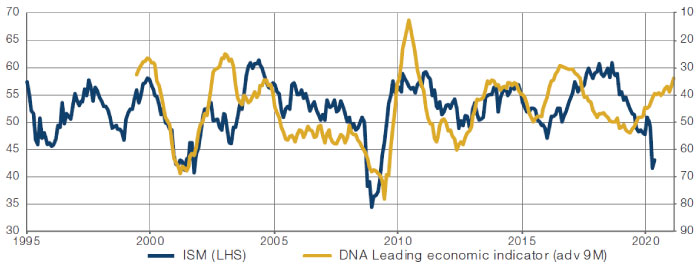
Source: Bloomberg; Man Solutions; as of 30 June 2020. Based on work originally done by Cornerstone Macro.
We have to add, at this stage, that the rule of thumb that equity bull markets run from one recession to the next has been especially true in a world of low and stable inflation. If we enter a world of higher average inflation – the topic of our Inflation Regime Roadmap – the investment landscape would change quite dramatically, such that higher inflation is likely to be bearish for risky assets even in the absence of a recession. But first things first.
Second, policymakers around the world are ‘all-in’ – both through fiscal and monetary policy – and it seems likely they will continue to err on the side of extreme stimulus before withdrawing policy. It is quite possible that MMT-type2 policies – large fiscal spending facilitated by central bank buying of bonds – become the norm for much longer than just during the crisis period, and this may be even more true if the next US President, Senate and House are Democrat.
Third, investors are still cautious, and there is no sign of euphoria. This can be seen in a range of indicators we track, including, for instance, the AAII net bullish sentiment from Figure 1, which languished at -24% on 18 June, still one of the lowest readings ever. Indeed, only 4% of historical readings having been lower since the survey’s inception in 1987.
The fly in the ointment? Valuations of traditional assets are high. The 1-year forward earnings multiple for European and US equities, for instance, is 18x and 22x, respectively, both the highest since 2002, according to Morgan Stanley (Figure 3). Now, because earnings estimates are highly uncertain, and because the right earnings multiple on trough earnings is hard to calibrate, it is useful to also consider the Shiller price-to-earnings (‘PE’) ratio, which is a normalised valuation of equities. Based on this, US equities are still shockingly expensive, at 29.4x. At the end of the GFC bear market in March 2009, one could briefly buy US equities at 11.8x Shiller PE. In comparison, even on 23 March 2020, the multiple was still 21.1x, versus a long-term median of 16.4x.
Figure 3. MSCI Europe 12-Month Forward Price to Earnings (Latest = 17.6)
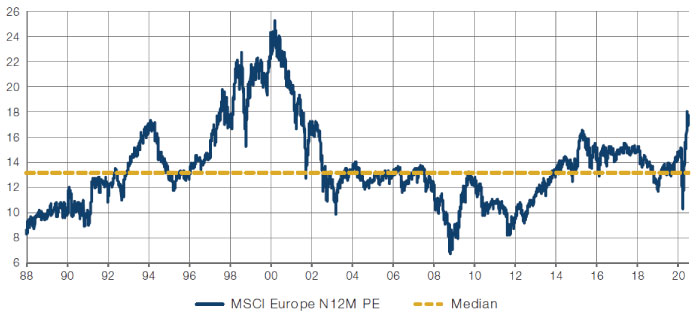
Source: Morgan Stanley, MSCI; as of 30 June 2020.
But it is not a good idea to be bearish on such valuation grounds, in isolation. On a 1-year view, these types of indicators are not good predictors of future returns, historically. Even more importantly right now, what is the fair multiple for equities when rates are zero and central banks are buying junk bonds? For instance, a more bullish valuation argument goes as follows: the 1-year forward dividend yield of MSCI World is currently 2.3%, and this is a real number in the sense that dividends will grow roughly in line with economic growth. Nominal government 10-year rates in US, UK, Japan, France and Germany are 68, 19, 0, -13 and -46 basis points, respectively, at the time of writing. MSCI World looks very attractive seen that way, aka T.I.N.A. – There Is No Alternative.
In fixed income, we are bullish on spreads, but not duration. Could bonds still be a good investment here? Clearly with nominal rates around zero and real rates well negative, you won’t get rich from owning bonds. Bonds could be a good store of value if secular stagnation remains the dominant theme, and there is even a possibility that bonds will still perform very well from here, in the scenario that the US adopts significantly negative policy rates. This is not our base case. We do expect central bank buying to prevent bond yields from rising a lot, even if inflation rises significantly. In our view, credit spreads are still attractively priced.
The Risks
There are plenty of risks near-term, though. We are optimistic on risky assets on a horizon of a year or longer. However, there are a series of shorter-term considerations that are more concerning, as well as one overarching long-term consideration. Near-term, we see the following challenges and uncertainties for risky assets.
First is a second wave of…earnings downgrades. We have looked at this in some detail for MSCI Europe. Morgan Stanley, for instance, expects a 45% fall in EPS in 2020, versus current consensus expectations of -28%. Historically, on average, equities trough about two weeks before earnings revisions. The range has been that equities have troughed 12 weeks before EPS revisions in 1992, and 17 weeks after EPS revisions in March 2009. The first earnings revisions trough is already behind us – certainly, earnings revisions won’t get worse than the 22-year low earlier this year (Figure 4). However, we think a second wave of downgrades is quite likely later this year, especially considering the challenges in the process of opening up the economy and withdrawing support policies, and the risk of a second Covid-19 wave, given the absence of a vaccine or herd immunity.
Figure 4. MSCI Europe 12-Month Forward Earnings Revisions Ratio
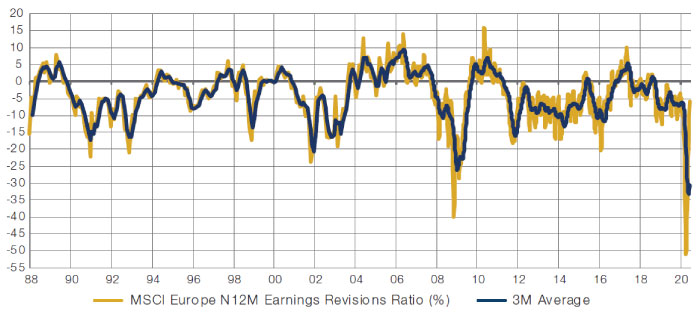
Source: Morgan Stanley, MSCI.
Furthermore, we are in a seasonal weak period that has some statistical significance – ‘Sell in May and Go Away Till Labor Day’. And finally, our family of Composite Valuation Indicators – aka CVIs – which told us to buy when markets were low, are now closer to a sell signal than a buy signal (Figure 5).
Figure 5. Europe Composite Valuation Indicator (Latest = 0.27)
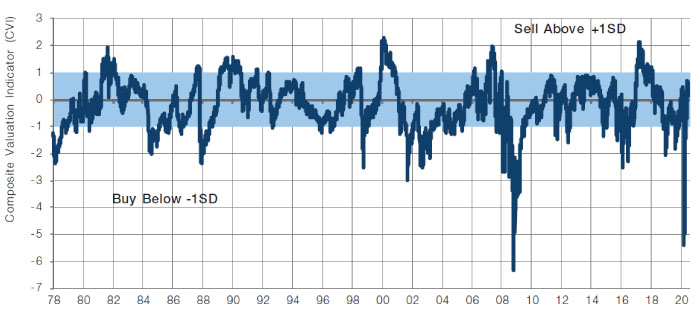
Source: Morgan Stanley; as of 30 June. Illustrative example – for information only.
The long-term consideration that is concerning to us is the prospect of entering a period of much higher inflation. It is now our base case to enter an inflationary regime for years to come after the Covid-19 recession. It may take a while before we enter that phase, but it could be sooner than most expect, because markets are not priced for it, and the US Presidential election has a major potential to make inflation a theme that is much nearer.
If Joe Biden wins the election in a Democratic sweep, and if Stephanie Kelton has anything to say about economic policy, then MMT / helicopter money / fiscal QE becomes a much more likely scenario, in our view. We have just finished reading ‘The Deficit Myth’ by Kelton, and we think she makes a revolutionary case that is highly compelling to a Democratic US President. She makes two key points: first, there are no limits to government spending, other than the resulting inflationary pressures; and second, a federal job guarantee should be implemented as the ultimate automatic stabiliser. Even the Fed is making some such noises: for instance, a recent paper published by the St Louis Fed entitled ‘How To Achieve a V-shaped Recovery Amid the COVID-19 Pandemic’ argued for aggressive fiscal and monetary policies that need to continue also after the crisis.
Value Versus Growth
We end with some thoughts on the Value versus Growth debate. We believe a disciplined value style will continue to deliver outperformance over time, as behaviourally, investors tend to overpay for the exciting stories, and underpay for the less exciting ones. Value will do especially well if, indeed, we enter a period of higher nominal growth, as per our Inflation Regime Roadmap. We also like the set-up from a contrarian point of view, in the sense that a large part of current investment professionals has never seen a period with persistent outperformance of value stocks.
Value has not outperformed in the disinflationary world dominated by secular stagnation, QE and austerity of the last decade. Indeed, if it persists, value may continue to underperform. We notice that the Growth style has had other periods of large and prolonged superior performance, with the Nifty Fifty and the TMT groupings, which only ended when inflation rose meaningfully in 1973, or when interest rates went up a lot in 2000.
We believe it is important to keep on measuring the valuation of both styles, and the US research firm Empirical Research is a good source for this. Not only do they calculate that value stocks are currently close to 2 standard deviations cheaper than usual, but they also consider a group of ‘big growers’, the 75 large-cap stocks with the very-best growth prospects. The median such issue is priced at 2x the market multiple five years out, versus an historical average of 1.4x five years out (Figure 6). If secular stagnation persists, it could stretch further still, but reversion-to-the-mean will do its usual effective job if we enter a period of higher nominal growth for instance through higher inflation. The stakes are high.
Figure 6. Empirical Research ‘Big Growers’ Median Forward Relative PE Ratios
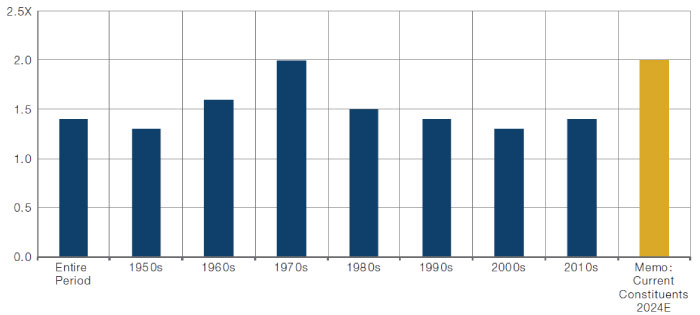
Source: Visible Alpha, Empirical Research Partners; As of 30 June 2020. Based on actual 5-year forward earnings.
1. American Association of Individual Investors.
2. Modern Monetary Theory.
You are now leaving Man Group’s website
You are leaving Man Group’s website and entering a third-party website that is not controlled, maintained, or monitored by Man Group. Man Group is not responsible for the content or availability of the third-party website. By leaving Man Group’s website, you will be subject to the third-party website’s terms, policies and/or notices, including those related to privacy and security, as applicable.