The narrative of US exceptionalism – which has been the principal driver of markets for over two years – is starting to show cracks under the weight of weakening economic fundamentals, persistent inflation, and the uncertainty driven by the Trump administration’s policies.
Stocks tumbled on Monday with the S&P 500 down 2.7% after recording the worst week since early September last week, also dragging down European and Asia equity markets.
Of course, ‘it ain't over till the fat lady sings.’ Markets are still richly valued, even if it does feel like we are at an inflection point. Given recent moves though, one would be forgiven for thinking that Brünhilde was warming up, and the finale was about to commence.
While that operatic metaphor may fall on deaf ears, the risks are real. With global valuations still close to all-time highs and sentiment indicators flashing warning signs, it might be wise to start thinking defensively.
Valuations at breaking point?
To illustrate the point, Bloomberg has plotted a combination of valuation metrics for the US market all the way back to 1900 (Figure 1). The first observation is that the US has never been more expensive than it is now, and that includes both the Wall Street Crash and the DotCom bubble.
Figure 1. Brünhilde’s high notes: valuations still at historic highs, but is it time to think defensively?
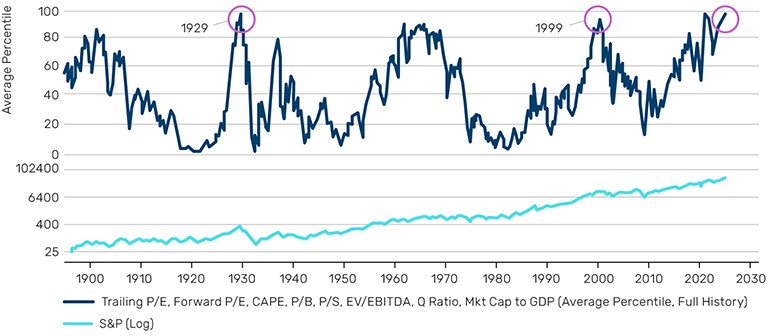
Source: Reproduced with the permission of Simon White, Bloomberg. Data up to 31 January 2025.
The second observation is that it’s an awfully long way down from here. This is made even starker by how disconnected valuations are from sentiment, with the American Association of Individual Investors’ (AAII) bull-bear spread currently at levels surpassed only twice in the last twenty years (Figure 2).
Figure 2. Sentiment disconnect – bearish investors amid sky-high valuations
Source:The AAII Investor Sentiment Survey. As at 6 March 2025.
Problems loading this infographic? - Please click here
The AAII bull-bear spread measures the difference between the percentage of bullish and bearish investors, offering a snapshot of individual investor sentiment. In the latest weekly survey ending 6 March, bullish sentiment – expectations that stock prices will rise over the next six months – sits at just 19%, half the historical average. Meanwhile, bearish sentiment is historically elevated at close to 60%, compared to an average of just over 30%. At current levels of valuation and sentiment, the risk of a correction is far from implausible.
Just how far can they fall?
Investors who have been rewarded with back-to-back 20% gains in the S&P 500 over the last two years would be remiss to forget just how far markets can fall, with equities having lost half their value not once, but twice since 2000. And that’s before considering smaller drawdowns, such as the near-20% drop as recently as 2022.
While hedging equity portfolios can be notoriously expensive – such as with a rolling put options strategy – or unreliable, as in the case of holding ‘safe haven’ US Treasury bonds, it doesn’t have to be. Dynamic strategies, such as trend-following and long-short quality, have a strong track record of providing crisis protection, performing best when equities, and also bonds, are at their worst, and offering a reliable first line of defence.
The fat lady may not have sung yet. But be under no illusion: the stage is set.
All data Bloomberg unless otherwise stated.
With contributions from Rupert Goodall, Client Portfolio Manager at Man AHL.
You are now leaving Man Group’s website
You are leaving Man Group’s website and entering a third-party website that is not controlled, maintained, or monitored by Man Group. Man Group is not responsible for the content or availability of the third-party website. By leaving Man Group’s website, you will be subject to the third-party website’s terms, policies and/or notices, including those related to privacy and security, as applicable.