The Magnificent Seven (M7)1 took flight in 2023 but soared in 2024, delivering an average total return of 60.5%! A year ago, we made the “somewhat boring prediction” that these companies – emblematic of US exceptionalism – would, in aggregate, deliver mid-single-digit annualised returns over the next decade.
A 60.5% surge in one year – equivalent to 4.8% annually if spread over a decade – might suggest we were… wrong? Or maybe not. While such a spectacular year makes last year’s prediction seem overly cautious, longer-term returns tell a different story: one exceptional year doesn’t define a decade. The M7’s dominance reflects their profitability, competitive moats and importance to global equity markets. The question is whether such returns are sustainable.
Increasingly demanding valuations and growth expectations, alongside their unprecedented market dominance, pose risks for investors. These include reduced diversification and the potential for normalisation of extreme outperformance over time.
Extraordinary gains, but stretched valuations
At the end of 2024, the M7 accounted for more than a third of the S&P 500, nearly a quarter of the MSCI World, and more than a fifth of the MSCI ACWI.
Figure 1: Dominating global stock markets
| S&P 500 | MSCI World | MSCI ACWI | |
|---|---|---|---|
| Apple | 7.60% | 5.45% | 4.91% |
| NVIDIA | 6.61% | 4.72% | 4.25% |
| Microsoft | 6.29% | 4.26% | 3.84% |
| Alphabet | 4.04% | 2.96% | 2.67% |
| Amazon | 4.12% | 2.97% | 2.67% |
| Meta | 2.56% | 1.83% | 1.65% |
| Tesla | 2.26% | 1.66% | 1.50% |
| Total | 33.48% | 23.85% | 21.49% |
Source: Man Numeric, as at 31 December 2024.
Their extraordinary 2024 performance was driven by strong profit growth and rising valuations. Most, except Tesla, saw double-digit increases in forward earnings expectations, while higher valuation multiples lowered forward free cash flow (FCF) yields – the percentage of a company’s price expected to be returned as future cash.
This is where the challenges begin. At the start of 2024, the equal-weighted average forward FCF yield for the M7 stood at 3.5%, but by year-end it had fallen to 2.6%.
Meanwhile, the yield on the US 10-year bond rose from 3.88% to 4.57%, creating a stark valuation gap. For most of these companies, the decline in FCF yield reflects a sharp increase in capital expenditures, which has outpaced gross cash flow growth.2
Figure 2: Exceptional gains, shrinking free cash flow yields
| 2024 Total Return | 2024 Fwd Earnings Growth | Dividend | 1/1/24 Fwd Earnings Yield | 12/31/24 Fwd Earnings Yield | 1/1/24 Fwd FCF Yield | 12/31/24 Fwd FCF Yield | |
|---|---|---|---|---|---|---|---|
| AAPL | 30.7% | 13.1% | 0.4% | 3.5% | 3.1% | 3.7% | 3.1% |
| NVDA | 171.2% | 117.3% | 0.0% | 4.0% | 3.2% | 3.8% | 2.6% |
| MSFT | 12.9% | 15.0% | 0.7% | 3.2% | 3.3% | 2.6% | 2.4% |
| GOOGL | 36.0% | 33.9% | 0.3% | 4.8% | 4.7% | 5.2% | 4.0% |
| AMZN | 44.4% | 73.1% | 0.0% | 2.4% | 2.9% | 3.6% | 2.6% |
| META | 66.0% | 42.8% | 0.4% | 5.0% | 4.4% | 4.7% | 3.2% |
| TSLA | 62.5% | -10.0% | 0.0% | 1.4% | 0.8% | 1.1% | 0.5% |
Source: Man Numeric, Bloomberg, as of 31 December 2024
Valuations: The starting point matters
With valuations now even more demanding, the M7 face significant headwinds. Using updated discounted cash flow (DCF) models, last year’s estimate that the group is poised to deliver mid-single-digit annual returns over the next decade still holds. Producing 10% annualised returns – the kind of performance many investors might hope for – looks increasingly unlikely.
Figure 3 illustrates the discount rates (i.e. expected returns) for the M7 based on assumed FCF growth rates over the next decade.
Figure 3: High hopes, more modest returns
| EV | Fwd FCF | FCF Gro | Terminal Gro | Discount Rate | Fair Value | |
|---|---|---|---|---|---|---|
| AAPL | $ 3,839 | $ 117 | 5.0% | 2.5% | 6.2% | $ 3,860 |
| NVDA | $ 3,261 | $ 86 | 5.0% | 2.5% | 5.7% | $ 3,305 |
| MSFT | $ 3,152 | $ 74 | 5.0% | 2.5% | 5.4% | $ 3,145 |
| GOOGL | $ 2,260 | $ 93 | 5.0% | 2.5% | 7.5% | $ 2,245 |
| AMZN | $ 2,377 | $ 61 | 5.0% | 2.5% | 5.6% | $ 2,406 |
| META | $ 1,457 | $ 47 | 5.0% | 2.5% | 6.4% | $ 1,469 |
| TSLA | $ 1,276 | $ 6 | 15.0% | 2.5% | 4.0% | $ 1, 227 |
Source: Man Numeric, as of 31 December 2024. Forward-looking market analysis is provided for illustrative purposes only and is subject to change due to a variety of factors, including fluctuating market conditions and economic factors.
Alphabet and Meta continue to show the highest expected returns, with Apple close behind. These numbers are largely in line with last year’s analysis, as we’ve slightly raised FCF growth assumptions to account for elevated growth and inflation expectations.
Figure 4 reveals the challenge: the annualised FCF growth rates required over the next decade to achieve a 10% annualised return are steep. For example, NVIDIA would need to grow FCF at 17% annually to meet this target, while Apple would need 15%. These figures are ambitious for some, particularly when compared to past growth rates: While NVIDIA has delivered 55% annualised FCF growth over the last decade, Apple has achieved just 5%,3
Figure 4: Steep climb ahead: Ambitious growth needed for 10% returns
| EV | Fwd FCF | FCF Gro | Terminal Gro | Discount Rate | Fair Value | |
|---|---|---|---|---|---|---|
| AAPL | $ 3,839 | $ 117 | 15% | 3.0% | 10.0% | $ 3,907 |
| NVDA | $ 3,261 | $ 86 | 17% | 3.0% | 10.0% | $ 3,325 |
| MSFT | $ 3,152 | $ 74 | 19% | 3.0% | 10.0% | $ 3,302 |
| GOOGL | $ 2,260 | $ 93 | 11% | 3.0% | 10.0% | $ 2,330 |
| AMZN | $ 2,377 | $ 61 | 17% | 3.0% | 10.0% | $ 2,343 |
| META | $ 1,457 | $ 47 | 14% | 3.0% | 10.0% | $ 1,461 |
| TSLA | $ 1,276 | $ 6 | 41% | 3.0% | 10.0% | $ 1, 280 |
Source: Man Numeric, as of 31 December 2024. Forward-looking market analysis is provided for illustrative purposes only and is subject to change due to a variety of factors, including fluctuating market conditions and economic factors.
Historical perspective: Lessons from size dominance
Stepping back, it’s worth considering the broader implications of size dominance in US equity markets. Using Fama-French data, we examined the performance of the largest decile of stocks – representing the top 10% of companies by market capitalisation – versus the next-largest decile, which includes companies ranked just below this top tier. By analysing these groups on a rolling five-year basis, we can assess how the biggest stocks perform relative to their slightly smaller peers.
Figure 5 shows that the current size dominance of the M7 is at levels last seen in the aftermath of COVID (2020), the 1990 recession, and the peak of the Nifty Fifty (1973). The only times these levels were exceeded were during the Great Depression and the late-1990s tech bubble. Historically, such extremes have been followed by significant reversion.
Figure 5: Magnificent and dominant
5-year rolling value weighted biggest decile minus 9th decile
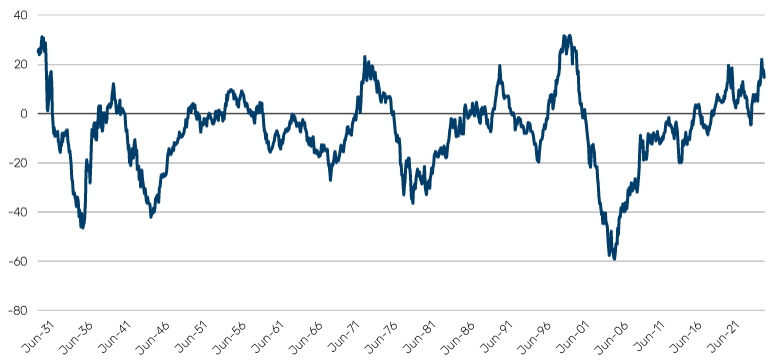
Source: Kenneth R. French - Data Library, as of 31 December 2024
Figure 6 highlights an important trend: whenever the five-year spread between the largest and next-largest decile has reached current levels (+14.7%), the largest decile has never outperformed the next decile over the following five years. That said, history does occasionally surprise. For example, in October 2019, the realised spread was +9.2%, yet the subsequent period produced a further +14.7%.
Figure 6: Past performance can be indicator of future reversals
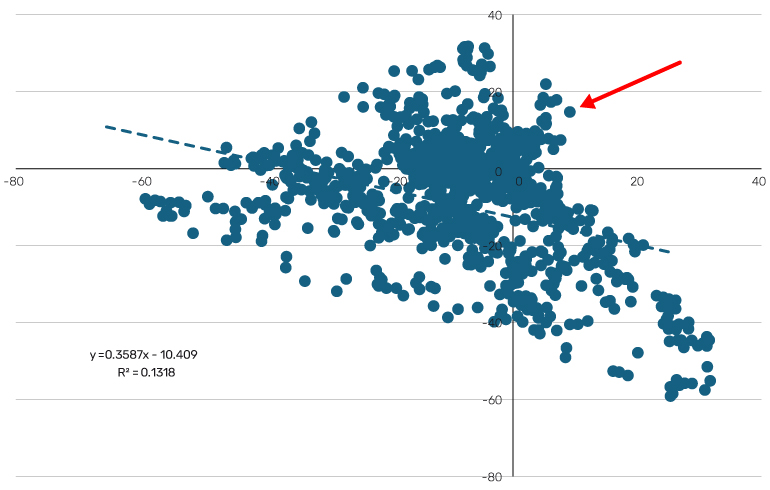
Source: Kenneth R. French - Data Library, as of 31 October 2024.
What’s likely (and unlikely) from here?
Looking ahead, it’s possible that the M7 will continue to dominate, leveraging their scale, profitability, and technological moats. It has been a fool’s errand to bet against this group and we are not naive enough to suggest you should now. However, what seems unlikely is a repeat of 2024’s remarkable multiple expansion. It’s also unlikely that the M7 can sustain another sharp rise in capital expenditures without a proportional increase in revenues or margins.
More broadly, global equity markets today are more concentrated than ever before. While diversification felt unnecessary in 2024 – or even the last decade – there may come a time when investors wish they had more of it.
Passive investing may have amplified the M7’s gains, but history warns that top-heavy markets, like the Nifty Fifty or the late-1990s tech bubble, often face reversals – even in less index-driven eras.
For contrarian investors, opportunities still exist beyond the M7. And who knows, you might even uncover the next member of this elite group.
Gilt Yields: When Mr Market Should be Your Portfolio Manager
There’s been much noise in the British media about gilt yields, which hit new post-Global Financial Crisis highs last week. Pundits have blamed Chancellor Rachel Reeves and her October budget, drawing parallels with the steep jump in yields and market turmoil we saw during Liz Truss’s premiership in 2022.
However, we need to be very careful of context, and there’s nothing better than plotting data to see the real story. It reveals that 10-year gilt yields rose more sharply relative to Treasury yields in 2022 than they have over the past three months.
Figure 7: Putting gilt yields into perspective
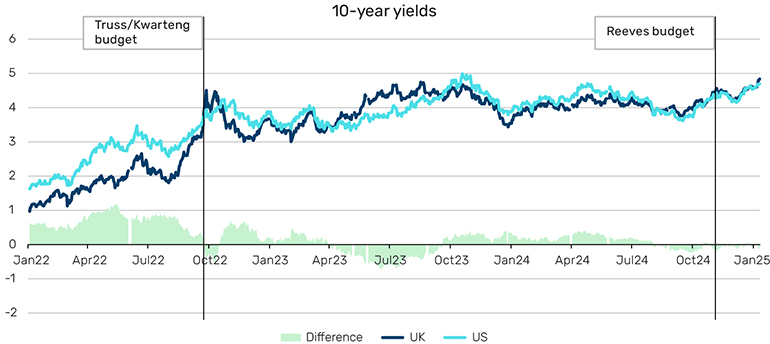
Source: Bloomberg as at 13 January 2025.
It’s worth noting that the 2022 ‘Truss’ episode appeared far more UK-specific, particularly when compared to the US. In contrast, the current episode doesn’t seem UK-specific at all – gilt and Treasury yields are largely moving in tandem. So, can we really blame Rachel Reeves?
Our lesson here is to be careful of what the media are saying. But you probably knew that already.
What does it mean for portfolios?
More importantly, there’s the question of what can be done. Hindsight is a wonderful thing, and naturally, we’d all like to believe we would have gone short during both the Truss and Reeves episodes. But would we? The ubiquitous ‘60/40’ portfolio is long-only – 60% equities, 40% bonds, notionally allocated. The theory assumes that when equities fall in value, bond prices will rise. However, this didn’t hold in 2022, and it’s not holding now.
So, what can investors do? Let’s consider both a long-only and a long/short perspective. Mr Market can help us a lot here.
Long-only portfolios, such as 60/40, are particularly exposed to shifts in correlations. Positive correlation works well when both bonds and stocks are rising, but it’s far less helpful when both are falling – as seen during the inflationary environment of 2022, when the 60/40 portfolio lost 14%, with negative contributions from both equity and bond components. That said, it is possible to monitor bond/equity correlations and use these signals to de-gear when the big red light is flashing.
Our chart is fascinating in the context of long/short portfolios, especially trend-following strategies. Note how prior to both the crisis in 2022 and the current episode, yields were steadily increasing.
Strategically shorting bonds
On both occasions, certain futures trend-following strategies were short bonds in aggregate, and short Treasuries and gilts specifically. There is no hindsight bias here.
Focusing on the current episode, notice how yields started rising before the US election in November 2024 as markets realised that either outcome – Trump or Harris – might be bad for fixed income.
Investors placed their bets, Mr Market spoke, and trend-following strategies responded accordingly and moved short. Incremental knowledge gets incorporated in markets, and that’s what drives the dynamic positioning of trend-following strategies. You could say that Mr Market is trend-following’s portfolio manager.
All data Bloomberg unless otherwise stated.
With contributions from Daniel Taylor, Chief Investment Officer at Man Numeric and Graham Robertson, Partner, Head of Client Portfolio Management, Man AHL.
With thanks to Andrew Beer for informative discussions.
Footnotes
1.The Magnificent Seven comprise Apple, NVIDIA, Microsoft, Alphabet (Google), Amazon, Meta and Tesla
2.Much of which has gone to NVIDIA for AI chips.
3.Note the Apple datapoint is somewhat sensitive to an outlier FCF datapoint for FY2015, and if one compared to FY2014 or FY2016, the annualised FCF growth would be closer to 10%.
You are now leaving Man Group’s website
You are leaving Man Group’s website and entering a third-party website that is not controlled, maintained, or monitored by Man Group. Man Group is not responsible for the content or availability of the third-party website. By leaving Man Group’s website, you will be subject to the third-party website’s terms, policies and/or notices, including those related to privacy and security, as applicable.