Buy the Spike?
In the era of ultra-low policy rates, ‘buy the dip’ has usually been an excellent strategy. But what about a related concept: buying into a VIX spike? After the VIX spiked by about 11 points on Friday 26 November to hit a 10-month high, we thought it worth discussing how this impacts returns.
Examining the top 20 VIX spikes of the last 30 years, two patterns emerge. If the S&P 500 Index is up in the week after the VIX spike, the majority of forward returns come during that first week, with a median return of 1.4% (Figure 1). As time goes on, returns drop, persisting into the second week less than half of the time (Figure 2). Furthermore, the average return in the second week is negative, although this improves over a 3-month basis.
However, the pattern reverses if the S&P 500 declines in the week after the VIX spike, as we saw between 29 November and 3 December. In this instance, returns persistence after the second week improves to 86%, and is 100% after three months. Mean and median returns are both positive, across all of our time periods, and the 3-month average return is about 6.4% higher than the ‘up after one week’ scenario (Figure 3).
What is also interesting is the distribution of VIX spikes through time. Four of the top 10 spikes have occurred since the Covid-19 pandemic, in addition to one each during the Dotcom Bubble (2001), the Global Financial Crisis (2008), the Asian crisis (1997), the Flash Crash (2010), and the Renminbi Devaluation (2015). While it probably isn’t news that the pandemic has made markets more volatile, Covid-related selloffs have occurred so frequently that, occasionally, we forget just how rare big moves in the VIX used to be.
Figure 1. Returns of S&P 500 After a VIX Spike
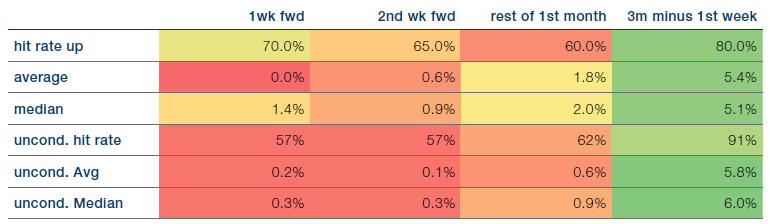
Source: Bloomberg, Man GLG; as of 30 November 2021.
Figure 2. Returns Persistence – S&P 500 Up in the Week After a VIX Spike
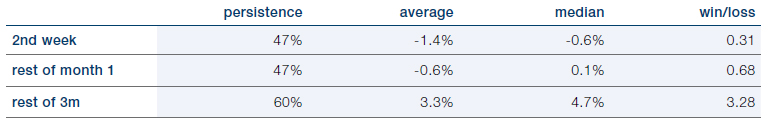
Source: Bloomberg, Man GLG; as of 7 December 2021.
Figure 3. Return Persistence – S&P 500 Down in the Week After a VIX Spike
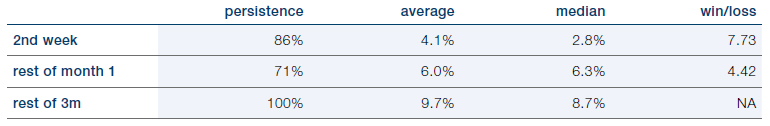
Source: Bloomberg, Man GLG; as of 7 December 2021.
Figure 4. Top 20 VIX Spikes Since 1991
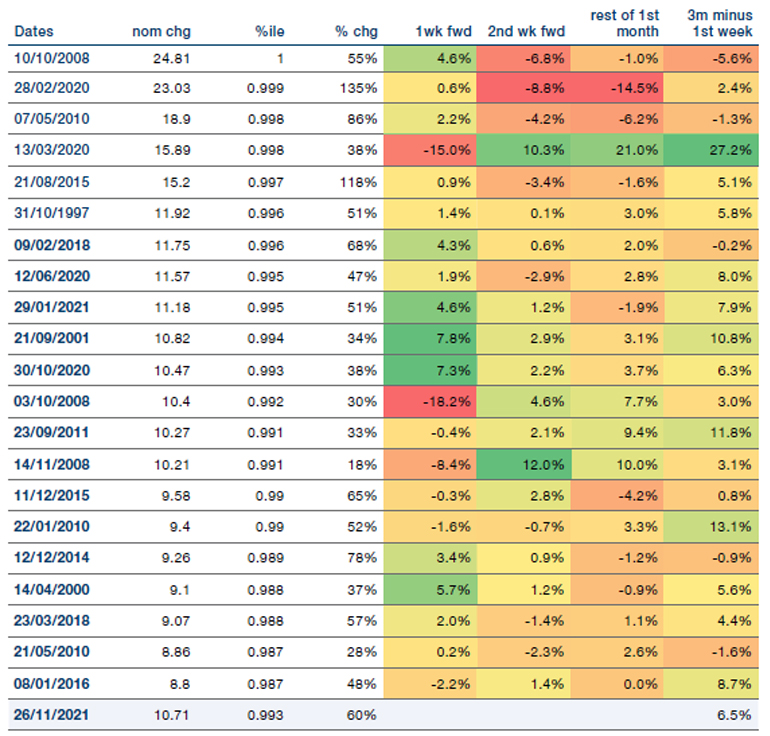
Source: Bloomberg, Man GLG; as of 30 November 2021.
In Case of Fire: Break Glass
According to our Fire & Ice model, we are in the midst of the ‘fire’ regime, where US CPI is moving upwards, first breaking through the 2% barrier and then the 5% one, before peaking. Our model suggests this regime started in March. Seeing as we do not know when peak inflation will be, we cannot yet say for sure whether the precedent of history will be followed.
Nevertheless, we can observe that most assets are thus far behaving as we would expect: government bonds and credit have both been weak in real terms; TIPS and broad commodities have been strong; energy equities, cross sectional momentum, Quality and Trend have also delivered robust numbers, consistent with Figure 5.
There are two areas, however, which display marked inconsistencies. Gold is expected to return 13% on a real annualised basis, but since March it is running at -3%. Secondly, US equities are on 25%, while history suggests they should have been returning -7%. This time could always be different, of course, but it’s worth being aware that if the historical performance precedents of fire re-assert themselves, equity investors could face quite an unwind.
Figure 5. Historical Real Returns
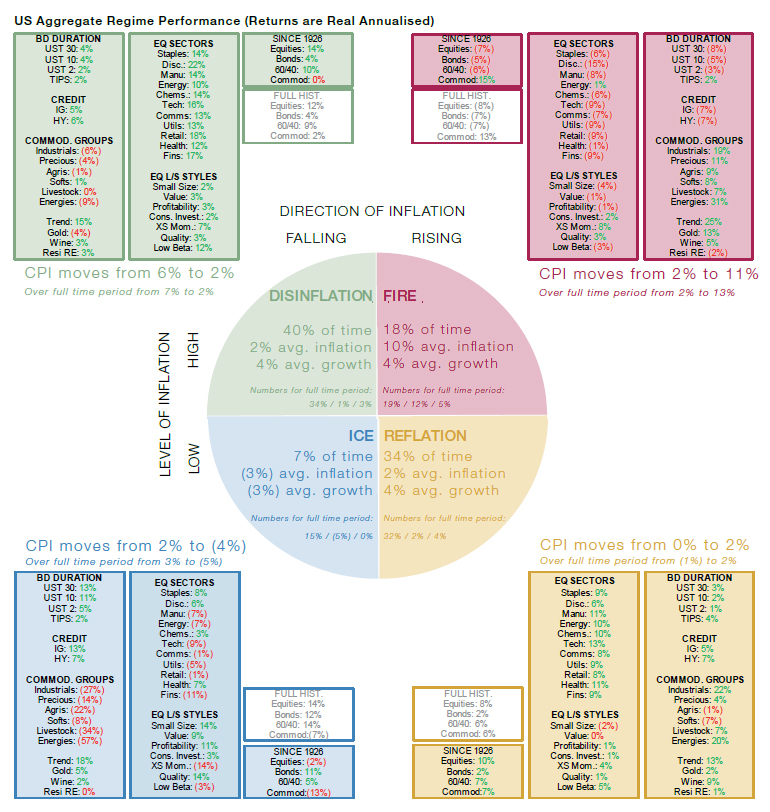
Source: Man Solutions; as of 6 December 2021.
Using data from Professor Shiller, Fama-French and Morgan Stanley. Equities refer to the S&P 500, Bonds refer to 7-10 year US Treasuries, IG refers to corporate issuance with BBB rating or higher, HY corporate issuance below BBB, ARP is equal risk contribution long/short portfolios of Value, Size, Momentum, Quality and Low Beta. For a fuller explanation please visit our website: www.man.com/dna and click the Fire & Ice dropdown box.
With contribution from: Ed Cole (Man GLG, Managing Director – Discretionary Investments) and Henry Neville (Man Solutions, Analyst)
You are now leaving Man Group’s website
You are leaving Man Group’s website and entering a third-party website that is not controlled, maintained, or monitored by Man Group. Man Group is not responsible for the content or availability of the third-party website. By leaving Man Group’s website, you will be subject to the third-party website’s terms, policies and/or notices, including those related to privacy and security, as applicable.