Introduction
The last few decades have seen a surge in companies abandoning their public listings and going private with the number of quoted US companies dropping by over 50% from a 19961 peak (Figure 1). Meanwhile the private market’s importance to the US economy is expanding: it now contributes 57.6% of US sales, more than two-thirds of private sector employment, and accounts for over 60% of GDP.2
Private markets also generate valuable insights for public market investors, yet these remain largely untapped owing to a prevailing lack of data transparency. Given this context, it is worth exploring the propagation of information from private to public markets and its use cases for public market investors.
Figure 1. Number of US Publicly Listed Companies
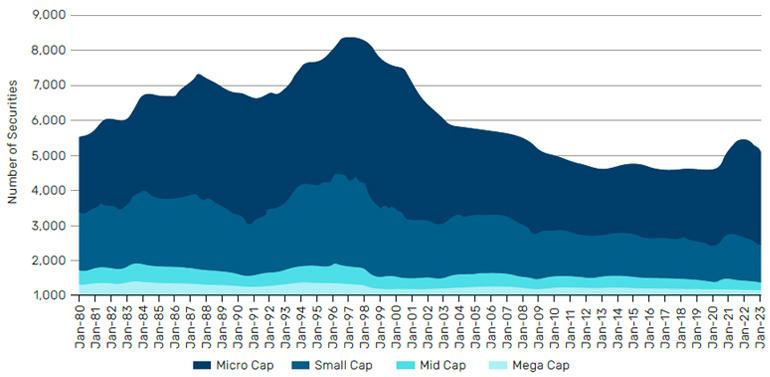
Source: CRSP U.S. Stock Database, as of December 2022.
Historically, it’s been challenging to quantify private market information, yet much of it has a predictive value for public markets and can in effect serve as a leading indicator.
With advances in natural language processing (NLP) techniques, the growing volume of private company information can be systematically extracted and made accessible. By leveraging this data, we demonstrate how this information can contribute to forecasting public market fundamentals, highlighting the flow of information from the private to the public sector.
The value of private market information
Progress in natural language processing techniques has facilitated access to private company information. While private companies are not required by law to publicly disclose their full financial statements, NLP techniques can systematically extract their top-line revenue figures from various public sources. These include public records, company reports/websites, press releases, social media, news outlets, deal transactions, and government agencies. For this analysis, we utilised a sample that includes US private companies with revenue exceeding 1 million dollars. This sample represents over 300,000 private companies in the US from 2004 to 2022.
The distribution of revenue among private companies is significantly skewed. Taking 2022 as an example, the median revenue is approximately 5.1 million dollars, with the 25th and 75th percentiles standing at 2.2 million and 15 million dollars, respectively. Revenue figures can stretch into the billions, with the top-tier private companies reporting revenues surpassing 100 billion dollars.
Both private and public companies exhibit similar distributions when viewing sectoral revenue as a percentage of the total private/public revenue. The consumer, financial, industrial, and technology sectors emerge as the top revenue-generating sectors as shown in Figure 2. Private companies yield a greater percentage of their revenue from the business services sector compared to public companies. Conversely, public companies accrue a higher revenue share from the healthcare and telecommunications sectors.
Problems loading this infographic? - Please click here
Although private and public sectors exhibit comparable revenue proportions by sector, their total company counts per sector demonstrate a distinct distribution. Notably, private companies far outnumber public ones, with the former exceeding the latter by more than a thousand times. When considering the percentage of company counts by sector (Figure 3), Business service and industry sectors comprise close to half of private companies. In contrast, the financial and healthcare sectors dominate a significant portion of the public market.
Problems loading this infographic? - Please click here
How it flows into public markets
To explore whether private market information can inform public investments and whether information propagates from private to public markets, we designed the following tests to examine the predictability of future public company fundamentals based on private market information.
We conducted a predictive regression to forecast future business segment level revenue growth for public companies in the US, using both past realised private and public revenue growth as explanatory variables. When forecasting future public revenue growth, both past public and private revenue growth yield statistically significant positive T-statistics (Figure 4).3 Therefore, both types of revenues are valuable in predicting future public revenue growth. The higher T-statistics and coefficients derived from the past revenue growth of the public sector indicate a consistent trend in public company revenue growth. Thus, the significance of private sector data in predicting public growth validates our hypothesis of information flow from the private to the public market.
Figure 4. Predictive Regression to Predict Public Revenue Growth
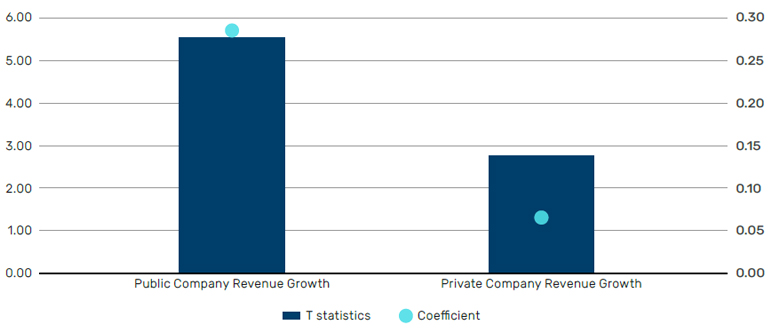
Source: Man Numeric, as of December 2022.
Building on this analysis, we further explored whether a similar information flow exists from the public to the private market. A subsequent predictive regression was conducted to forecast future revenue growth at the business segment level for private companies, again using past private and public revenue growth as explanatory variables. In this case, only past private revenue growth yielded statistically significant positive T-statistics (Figure 5), indicating a consistent trend in private company revenue growth. The lack of statistical significance for past public revenue growth suggests that, unlike the private-to-public dynamic, the flow of information from the public to the private sector is not as pronounced, highlighting a potential asymmetry in information transfer between the two markets.
Figure 5. Predictive Regression to Predict Private Revenue Growth
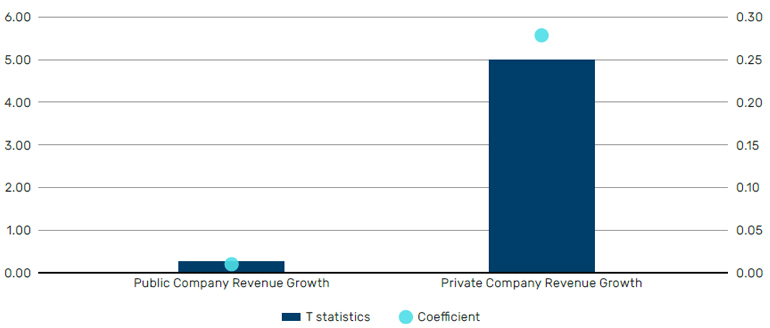
Source: Man Numeric, as of December 2022.
Conclusion
The trend of companies transitioning from public to private underscores the burgeoning importance of the private sector in the US economy. The potential of private market insights to inform public market investments is vast and still largely unexplored due to lack of data transparency. The advent of advanced natural language processing techniques allows for the systematic extraction and accessibility of private company information, which has been demonstrated to be instrumental in forecasting public market fundamentals. Our analysis affirms the flow of information from the private to the public sector. Therefore, a greater focus on harnessing private market information could lead to more informed and potentially profitable investment decisions in public markets.
1. CRSP US stock Databases, https://www.crsp.org/wp-content/uploads/2023/11/CRSP_Count_20230929.pdf
2. https://www.forbes.com/sites/sageworks/2012/10/01/private-companies-pull-economy-along/?sh=786312db2723
3. T-statistics, often used in hypothesis testing, is a type of inferential statistic that allows one to compare whether the means of two groups are significantly different from each other. It is calculated by taking the difference between the group means and dividing it by the standard error of the difference.
You are now leaving Man Group’s website
You are leaving Man Group’s website and entering a third-party website that is not controlled, maintained, or monitored by Man Group. Man Group is not responsible for the content or availability of the third-party website. By leaving Man Group’s website, you will be subject to the third-party website’s terms, policies and/or notices, including those related to privacy and security, as applicable.