Executive summary
In recent years, we have seen US companies increasingly dominate the developed markets (DM) large cap universe of stocks. For investors looking to retain exposure to DM, but to also diversify away from this trend, we believe global ex-US small caps offer a promising opportunity both in terms of diversification and richness of alpha. Furthermore, recent trends in liquidity have lowered frictions in these markets, with the median trading volume for the most liquid part of the universe having more than quadrupled since the lows after the Global Financial Crisis (GFC).1 Providing research is implemented responsibly, these developments have paved the way for quant strategies to potentially capitalise on the opportunity set – and at a lower cost.
Diversification to other DM Indices
Global ex-US markets offer exposure to developed markets, while remaining more idiosyncratic than the US market.1
The US market has always been highly correlated with global markets – a relationship which has only strengthened in recent years. US exposure in the MSCI World Index has increased in the past decade from approximately half of the benchmark to almost 70% today.2 Even global small cap markets are now almost 90% correlated with the S&P 500 Index and close to 60% US by benchmark weight (Figure 1). In contrast, global ex-US markets offer exposure to developed markets, while remaining more idiosyncratic than the US market.
Figure 1. Rolling 12-Month Correlation of S&P 500 with other DM Indices (Jan. 2003 – April 2023)
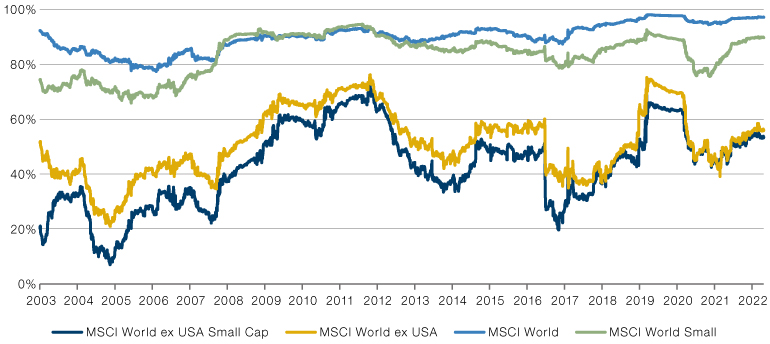
Source: Man Numeric, using market indices sourced from Bloomberg.
While both global ex-US large and small cap markets display a lower correlation with US markets, small caps offer further diversification in terms of sector exposure. As shown in Figure 2, of the developed market indices, the global ex-US small cap indices least resemble the S&P 500 in their sector weightings.
Figure 2. Correlation of Sector Weightings of S&P 500 with Other DM Indices (April 2023)
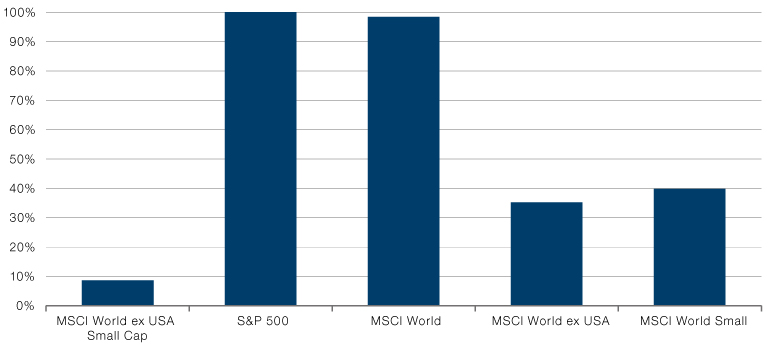
Source: Man Numeric, using market data sourced from Bloomberg, as of 30 April 2023.
Small caps remain sequestered from global trends because they offer more exposure to local markets.
Small caps remain sequestered from global trends because they offer more exposure to local markets. Global ex-US small caps source much lower percentages of their revenues from foreign sources relative to large cap names in the same markets.
Figure 3. Benchmark Weighted Percent of Revenue from Foreign Sales
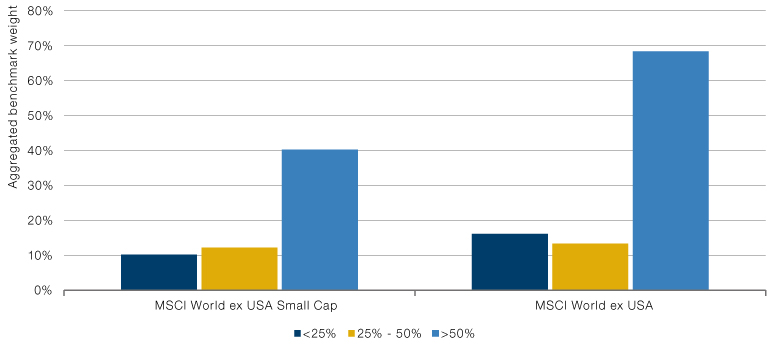
Source: Bloomberg, WorldScope, and Man Numeric, as of 30 April 2023.
Alpha opportunity
We believe the small cap space also offers significant alpha opportunities due to a mixture of more favourable valuations, lower index concentrations and higher model efficacy.
In fact, the delta between large and small cap foreign revenue sourcing has been marginally increasing. For large caps, the percentage of revenue from foreign sales has increased by almost 20% since the GFC. For small caps, on the other hand, the percentage has only increased by 10%.
Thus, we believe global ex-US small cap markets offer an opportunity to diversify from US markets, while remaining exposed to developed market macroeconomic trends.
We believe the small cap space also offers significant alpha opportunities due to a mixture of more favourable valuations, lower index concentrations and higher model efficacy.
General consensus is that global ex-US small caps have stronger growth prospects than their large cap counterparts. However, generally US market exposed indices have higher growth expectations as the US exposed large cap indices have around a quarter of their weight in information technology – compared to less than 10% for global ex-US indices.
Figure 4. Weighted Median Benchmark IBES Growth Estimate (January 2015 – April 2023)
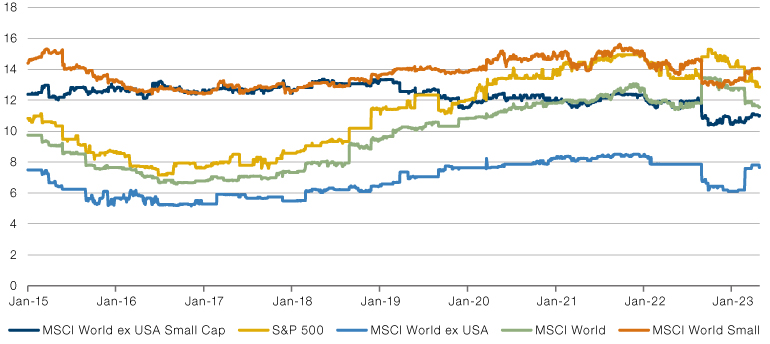
Source: Man Numeric, using market data sourced from Bloomberg, as of 30 April 2023.
However, that growth does not come cheap. When we look at price/earnings-to-growth (PEG) ratios for DM benchmarks, we see that growth is most favourably priced in the global ex-US small cap space. Global ex-US large caps, on the other hand, have the highest PEG ratios – with a substantial increase in recent years.
Figure 5. Weighted Median Benchmark PEG Ratio (January 2015 – April 2023)
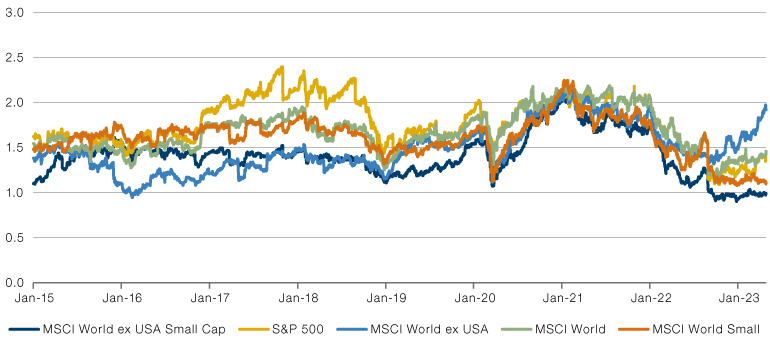
Source: Man Numeric, using market data sourced from Bloomberg.
Small cap market particularly suited to systematic approach
The small cap market lends itself better to a quant process than large cap markets.
Further, the small cap market lends itself better to a quant process than large cap markets. Quant processes perform best when index concentration is low as they tend to hold less concentrated portfolios and play on systemic themes. In highly concentrated markets it is not one theme which wins out, but rather one (or a small handful of) names. Portfolios which are not overweight even a few of these names will, therefore, underperform. In general, small cap markets tend to be far less concentrated than large cap markets. In the MSCI World ex USA Index, for example, the top ten benchmark names make up over 13% of the benchmark weight.3 For the global ex-US small cap benchmark, the top ten names make up just over 2%.
Small cap markets also lend themselves better to a quant process because they are less efficient. Well-known generic factors outperform in these markets far more than they do in large caps. Moving beyond generic, well-known factors, can be even more promising from an alpha generation point of view.
Figure 6. Cumulative Long/Short Performance of Barra Value and Momentum (January 2012 – April 2023)
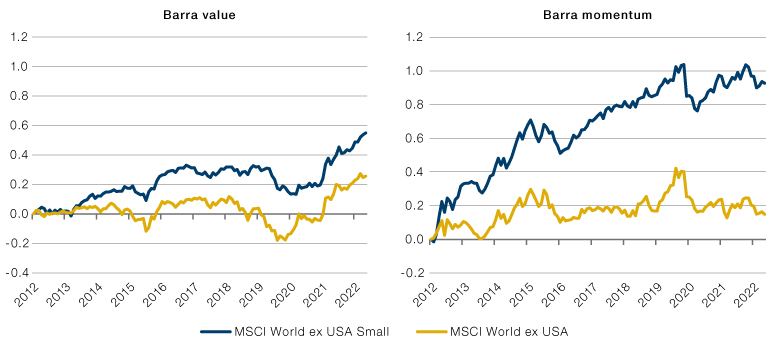
Source: Bloomberg, Barra, and Man Numeric. Barra factor performance shown is long/short quintile factor spreads, investing long in the top 20% and short in the bottom 20% ranked names. These spread returns are instantaneously rebalanced, sectorneutral and do not reflect transaction costs. Note the Barra Value is a combination of Barra Earnings Yield, Barra Dividend Yield, and Barra B/P. Past performance is not indicative of future results. Returns may increase or decrease as a result of currency fluctuations.
Implementation considerations
Global ex-US small cap markets have become more liquid recently, with the median trading volume for the most liquid part of the universe having more than quadrupled since the lows after the GFC.4
The diversification benefits and notable alpha opportunities in these markets are not necessarily novel concepts – although some of the trends have intensified in recent years. The implementation potential for a quant strategy in this space, on the other hand, has notably changed in recent history. In small cap markets, liquidity and trading costs are even more critical than they are in large cap markets. Global ex-US small cap markets have become more liquid recently, with the median trading volume for the most liquid part of the universe having more than quadrupled since the lows after the GFC.4 Thus, implementing alpha views has become not only easier, but also cheaper.
Figure 7. Median 65-day Trading Volume Top 1,500 Names Global ex-US Small Cap Universe, (January 2013 – April 2023)
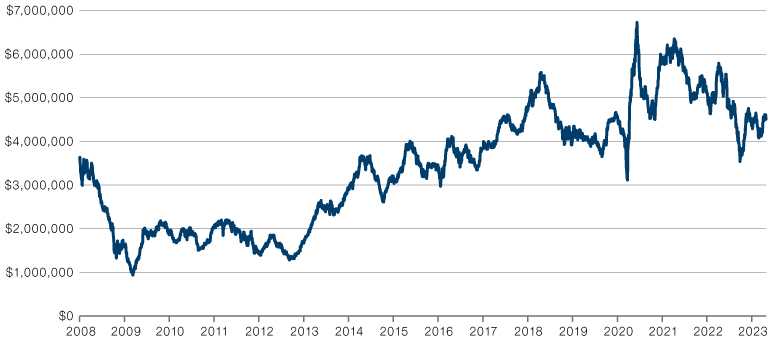
Source: Man Numeric. Includes top 1500 names by market cap within Global ex US Small Cap universe.
Even with decreasing trading frictions, capacity management remains particularly key in small cap markets as investing too much capital will deteriorate returns and dilute alpha.
Figure 8. Average Return and IR of Simulated Global ex-US Small Cap Portfolio by AUM, (January 2010 – April 2023)
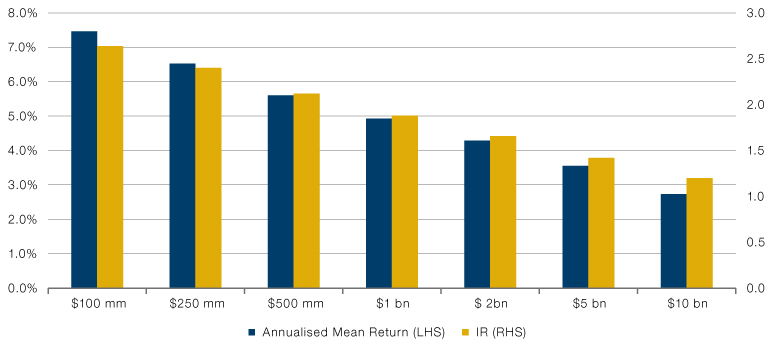
Source: Man Numeric. Please note the simulated data does not represent actual performance of an investment product and it should not be used as a guide to the future. This approach has inherent limitations, including that results may not reflect the impact material economic and market factors might have had on the investment manager’s decision-making and/or the application of any trading models had the strategy been managed throughout the period over which the simulated performance is illustrated.
Conclusion
In this paper, we have outlined the potential benefits of investing in global ex-US small cap strategies relative to other DM strategies, highlighting that global ex-US small caps are freer from the weighty influence of US markets and more differentiated in their sector composition and domestic-demand growth. Furthermore, we believe they offer greater alpha opportunities for quant processes through lower market concentration and higher factor and model efficacy. With these markets becoming increasingly liquid and more cost effective, we think now is potentially an opportune time to implement these alpha views, provided strong capacity discipline is exercised.
1. Source: Man Numeric.
2. Source: MSCI World Index
3. Source: Man Numeric.
4. Source: Man Numeric.
You are now leaving Man Group’s website
You are leaving Man Group’s website and entering a third-party website that is not controlled, maintained, or monitored by Man Group. Man Group is not responsible for the content or availability of the third-party website. By leaving Man Group’s website, you will be subject to the third-party website’s terms, policies and/or notices, including those related to privacy and security, as applicable.