Q1 Recap
Whenever we see outsized moves across markets, we find ourselves constantly searching for historical precedent. And it’s no different now. The current situation provides eerie similarities to the 1970s, when an oil shock heaped additional pressure on an already-elevated inflation backdrop. Instead of an oil crisis, the current exogenous shock has been the war in Ukraine, with a broad range of commodities spiking higher and fanning the inflation flame. The short-term implications are certainly going to crimp consumer disposable income and heap pressure on the margins of companies that are large consumers of commodities. Unfortunately, this is likely to have a disproportionally negative impact on lower-income regions, which will be hit harder by the rise in soft commodity prices such as wheat.
While recent tragic events naturally dominate our thoughts, it is worth remembering that the start of the year was defined by volatility triggered by quantitative tightening signals from a range of central banks. Indeed, rate hikes began well before invasionrelated volatility, with the Bank of England first out of the trap in December 2021. We have seen a number of rate hikes globally and the market is now pricing in more than eight hikes in the US, over five hikes in the UK and even a move closer to 0% in Europe (Figure 1). This led to a very challenging market backdrop for fixed income, with the first quarter seeing one of the worst returns for the Bloomberg Global Aggregate Index since inception (Figure 2).
Figure 1. Market Implied Policy Rates
Problems loading this infographic? - Please click here
Source: Bloomberg; as of 31 March 2022.
Figure 2. Bloomberg Global Aggregate Index Returns
Problems loading this infographic? - Please click here
Source: Bloomberg; as of 31 March 2022.
Tightening financial conditions are probably here to stay, with a number of pressure points reducing consumer disposable incomes – such as higher mortgage and energy rates. The US 30-year mortgage rate recently hit 4.5%, which while low on a long-term basis, is similar to levels that it peaked at during the past Federal Reserve hiking cycle in 2018. All signs are pointing towards a slowing growth environment over the coming quarters, with economists’ expectations being downgraded as we write.
Flows have taken this on the chin, with more than USD62 billion in outflows from fixed income assets globally in the first quarter of 2022 (Figure 3). This represents the largest drop since 2008, when the market experienced more than USD172 billion in outflows. In contrast, equity sentiment remains robust: the ‘buy-the-dip’ mentality is still evident across markets, with c. USD210 billion of inflows over the first quarter.
Figure 3. Global Equity and Bond Flows
Problems loading this infographic? - Please click here
Source: JP Morgan Flows & Liquidity, ICI, EPFR, EFAMA, Bloomberg; as of March 2022.
Note: Flows are from ICI (worldwide data up to Q4 2021). Data since then are a combination of monthly and weekly data from EPFR and ETF flows from Bloomberg. 2022 data as of end March.
Spreads have reacted to the macro and geopolitical backdrop and moved wider across the board (Figure 4). Europe broadly underperformed global markets with all-in spreads in pan-European investment grade (‘IG’) above the third quartile, which has historically been a level that provides investors with adequate compensation for recessionary risk (Figure 5). In developed high yield (‘HY’), spreads have moved in a similar fashion, but remain below third-quartile levels. In fact, they remain below median levels and are expensive in the US. Emerging markets were the weakest performer on the quarter, with Asian HY and EM HY corporate and sovereign bonds selling off due to Chinese real estate and Russian and Ukrainian exposures.
Figure 4a. Total Returns
Problems loading this infographic? - Please click here
Source: Bloomberg, ICE BofAML; as of 31 March 2022.
Figure 4b. Option Adjusted Spreads
Problems loading this infographic? - Please click here
Source: Bloomberg, ICE BofAML; as of 31 March 2022.
Figure 5a. Investment Grade – Historical Spreads
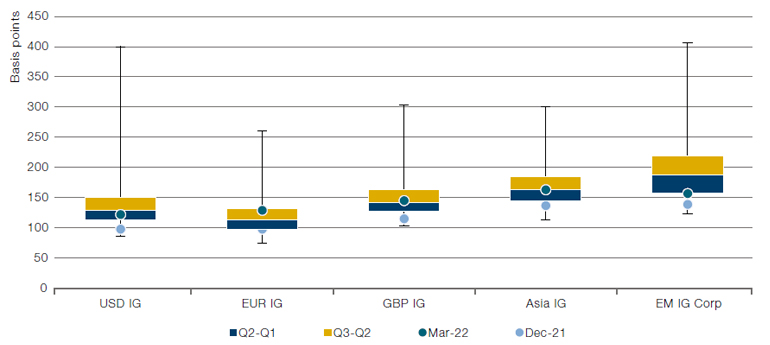
Source: Bloomberg, ICE BofAML; as of 31 March 2022 over the past 10 years.
Figure 5b. High Yield – Historical Spreads
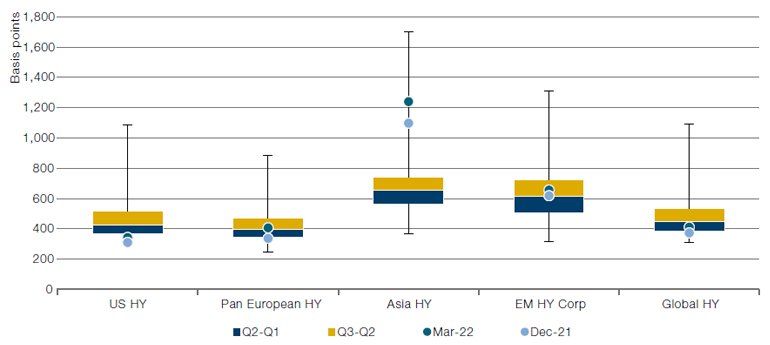
Source: Bloomberg, ICE BofAML; as of 31 March 2022 over the past 10 years.
Credit issuance remains constrained across markets.
Issuance in the US high yield bond market totalled c. USD47 billion and c. EUR10.9 billion in Europe in the first quarter of 2022.1 This compares with USD162.6 billion and EUR41 billion, respectively, in the first quarter of 2021. Convertible bond new issuance came in at USD8 billion in the quarter, the-second weakest first-quarter on record, below only the first quarter of 2009.2 Supply in the emerging-market corporate market was similarly depressed, coming in at USD99.4 billion, with a significant weight in investment grade issues. Indeed, the IG market is the outlier, which continues to remain open (although new issue premiums have remained healthy to encourage buyers).
Q2 Outlook
At Man GLG, we have one overriding principle: we have no house view. As such, portfolio managers are free to execute their strategies as they see fit within pre-agreed risk limits. Keeping that in mind, the outlooks below are from the different credit teams at Man GLG:
1. Source: Bloomberg; as of 31 March 2022.
2. Source: Bank of America.
You are now leaving Man Group’s website
You are leaving Man Group’s website and entering a third-party website that is not controlled, maintained, or monitored by Man Group. Man Group is not responsible for the content or availability of the third-party website. By leaving Man Group’s website, you will be subject to the third-party website’s terms, policies and/or notices, including those related to privacy and security, as applicable.