Key takeaways:
- Corporate bonds form the cornerstone of most insurers’ strategic asset allocation and typically comprise more than 50% of their balance sheet
- The ability to anticipate changes in creditworthiness – both downgrades and upgrades – is thus critical to insurance portfolios
- Research jointly conducted by Man Group, Pension Insurance Corporation (PIC), Stanford University and SAS demonstrates that advanced data analytics may potentially outperform traditional methods to provide a consistent and repeatable process for forecasting rating transitions
Introduction
For insurers and other regulated financial institutions, balance sheet management is a delicate process. Risk and return must be balanced and financial liabilities matched with appropriate assets that provide both stability and investment income. Corporate bonds play an essential role in this process and typically comprise more than 50% of insurers’ balance sheets. In this context, effective management of credit quality is fundamental to the asset-liability management (ALM) and capital allocation process. Further, the ability to anticipate changes in creditworthiness – both downgrades and upgrades – is critical.
A recent research paper, jointly published by Man Group, PIC, Stanford University and SAS, demonstrates that a quantitative credit process, powered by advancements in data analytics and machine learning, may offer more timely insights than traditional approaches. The study provides empirical evidence that machine learning techniques can potentially outperform traditional methods in predicting rating changes, equipping insurers with the insights needed to stay competitive in today's complex credit markets. Here we summarise the key findings from this research.
High stakes: credit migration for insurers
Before we dive in, it’s worth reminding ourselves of the challenge. Meeting policyholder claims – potentially decades in the future – is the fundamental obligation insurers face. This requires asset portfolios that deliver predictable cash flows and drawdown mitigation. While corporate bonds are ideally suited to meet these needs, their stability is contingent on the issuer's credit quality. For a regulated insurer, an unexpected downgrade is far more than just a mark-to-market loss. Indeed, it has direct consequences across several dimensions:
1. Capital management impact
An unexpected downgrade substantially increases capital charges while simultaneously eroding available regulatory capital – with particularly severe consequences when ratings fall below investment grade. This makes the asset less efficient from a return-on-capital perspective and reduces the insurer's regulatory capital coverage ratio, weakening its competitive position when underwriting new business.
2. Asset-liability management disruption
Long-term insurers meticulously match the duration and cash flow profile of their assets and liabilities, especially those operating in the asset-intensive reinsurance market. An unexpected downgrade can result in increased haircuts on asset cash flows under certain regulatory regimes, creating shortfalls in the asset portfolio cash flow required to match regulatory liabilities.
3. External credit rating pressure
External credit and financial strength ratings assigned to an insurer are fundamental to its ability to transact and underwrite new business. A deteriorating credit portfolio negatively impacts its assigned rating and outlook.
4. Forced selling consequences
Many insurance credit mandates have strict guidelines, prohibiting holdings of securities below certain credit ratings. A downgrade can thus force portfolio managers to sell assets at inopportune times, often into declining markets, crystallising losses and further impacting the insurer's capital position.
Conversely, identifying potential upgrades ahead of the market may allow an insurer to position itself to benefit from credit spread compression and positive price momentum, potentially enhancing portfolio returns without taking on additional credit risk.
Predicting credit rating changes with machine learning
In collaboration with PIC, Stanford University and SAS, we explored a machine-learning based framework for identifying firms with an elevated probability of being downgraded or upgraded. Credit markets have historically consumed less data than equity markets, but this is where the leaps we have seen in data availability and investors' ability to process it come into play. Our framework was developed using a proprietary dataset of credit transitions with over 507,000 issuer-month observations between 2001 and 2024.
Figure 1 shows the average monthly transition probabilities based on that data. The diagonal blue squares highlight both the infrequency and asymmetric nature of rating changes, demonstrating how challenging it is to forecast these transitions.
Figure 1. Empirical monthly transition matrix (2001-2024)
Problems loading this infographic? - Please click here
Source: ICE BofA IUC0 Index and Man Numeric proprietary data, as of December 2024.
Our analysis considered 48 potential drivers (or features) across five different categories that we believe could provide explanatory and predictive power to credit transition:
- Equity related variables, such as momentum
- Bond variables such as yield and option-adjusted spread
- Ratings variables such as current issuer-level rating, split ratedness of the issuer
- One-year default probabilities from SAS/Kamakura
- Macroeconomic variables
We found strong out-of-sample performance from our machine learning model in detecting downgrades compared to traditional modelling techniques, such as historical transition matrices or linear logistic regression models, when evaluated using ROC AUC (receiver operating characteristic - area under the curve) and precision-recall criteria.1
Note that a ROC AUC of 0.5 represents a random guess while an AUC of 1.0 represents a perfect model. As shown in the top part of Figure 2, our machine learning model achieves an ROC AUC of 0.9, indicating superior performance at predicting credit downgrades.
Meanwhile, precision-recall curves show how good a model is at finding rare events (such as credit default of an investment-grade issuer). Precision tells you, “When I flag something as risky, how often am I right?” while recall answers, “How many of the actual risky cases did I catch?”. Precision-recall AUC should be compared to the average occurrence of downgrades, which in our dataset is less than 1%. As shown in the bottom part of Figure 2, the precision-recall AUC for our machine learning model is 12%, representing a 20x improvement over random classification.
Figure 2. ROC curves and precision-recall
Problems loading this infographic? - Please click here
Problems loading this infographic? - Please click here
Source: Man Numeric proprietary data.
Our model identified the following features, shown in Figure 3, as the most influential drivers of credit transitions, based on their contribution to the machine learning model’s predictive performance.
Figure 3: Predictors ranked by importance
Problems loading this infographic? - Please click here
Source: Man Numeric proprietary data. Notes: Importance values are the model-reported relative contributions of each feature. Higher values indicate greater impact on the model's predictions.
The importance of option-adjusted spread and yield is well documented, as the bond market tends to price ratings changes well before they occur. Equity market features, such as momentum, also emerge as highly influential, alongside fundamental indicators including default probability and current issuer rating, which serve as critical drivers of transition probability. In contrast, split issuer ratings from rating agencies, a frequently considered feature, were a less significant contributor to future credit migration in our fitted model.
The goal in utilising advanced machine learning techniques is not to build a “black box” model that replaces a skilled credit analyst, but rather to create a tool that augments their knowledge. A well-calibrated systematic process may offer more breadth and continuous monitoring of the entire universe of issuers seeking to provide data-driven insight that might help investors identify firms with an elevated possibility of a rating transition in a timely manner.
Consistency is another key advantage of this approach. A systematic process evaluates every issuer in the universe against the same rigorous framework, creating a disciplined and repeatable process for credit assessment that allows the insurer to more proactively manage its credit portfolio and capital position.
Potential limitations
While machine learning models offer promising advances in predicting credit rating changes, there are also limitations which warrant consideration. Firstly, model performance may not persist across future market regimes or tail scenarios, and false positives risk unnecessary turnover and transaction costs. For insurers with strict mandate guidelines, acting on model-driven signals could also risk crystallising losses in illiquid conditions.
To put our model to the test, we worked with our partners to identify two case studies we felt were newsworthy examples of “fallen angels”. It is important to note that, while we believe the results to be accurate, this analysis is provided in hindsight.
Case study 1: Silicon Valley Bank
What was the first sign of trouble for Silicon Valley Bank (SVB)? The first draft of history pinpointed 8 March 2023, when SVB’s parent group announced it was attempting to raise additional capital. Our quantitative analysis, however, identified causes for concern in late 2022 when SVB bonds were still rated investment grade and trading around 85 cents on the dollar.
Specifically, several of our micro bottom-up signals highlighted SVB’s bonds as potential candidates to short or divest. The bank was increasing its leverage profile at the time through a higher quantum of debt. Further, its bonds were attracting an elevated level of short interest – roughly six times higher short utilisation than peers, as shown by the negative bond short interest score in Figure 4 below.
Figure 4. Warning signs: negative bond short interest
Problems loading this infographic? - Please click here
Source: Man Numeric proprietary data. This analysis is provided for informational purposes only. It does not constitute investment advice and should not be construed as a recommendation to buy or sell any security.
Most emphatic, though, was the network-based analysis. Through this analysis, it became clear that SVB’s ecosystem – its customers, partners, and competitors – was highly exposed to technology companies during a period when these names were under considerable pressure. This network exposure was relatively unusual compared to many other regional banks. As an illustration, in Figure 5, we showcase a sample network structure, where the nodes represent companies and edges represent connections. This ultimately highlights the interconnected nature of downgrade and default risk as information flow across companies transmits through economic relationships.
Figure 5. Network analysis reveals concentrated Tech exposure
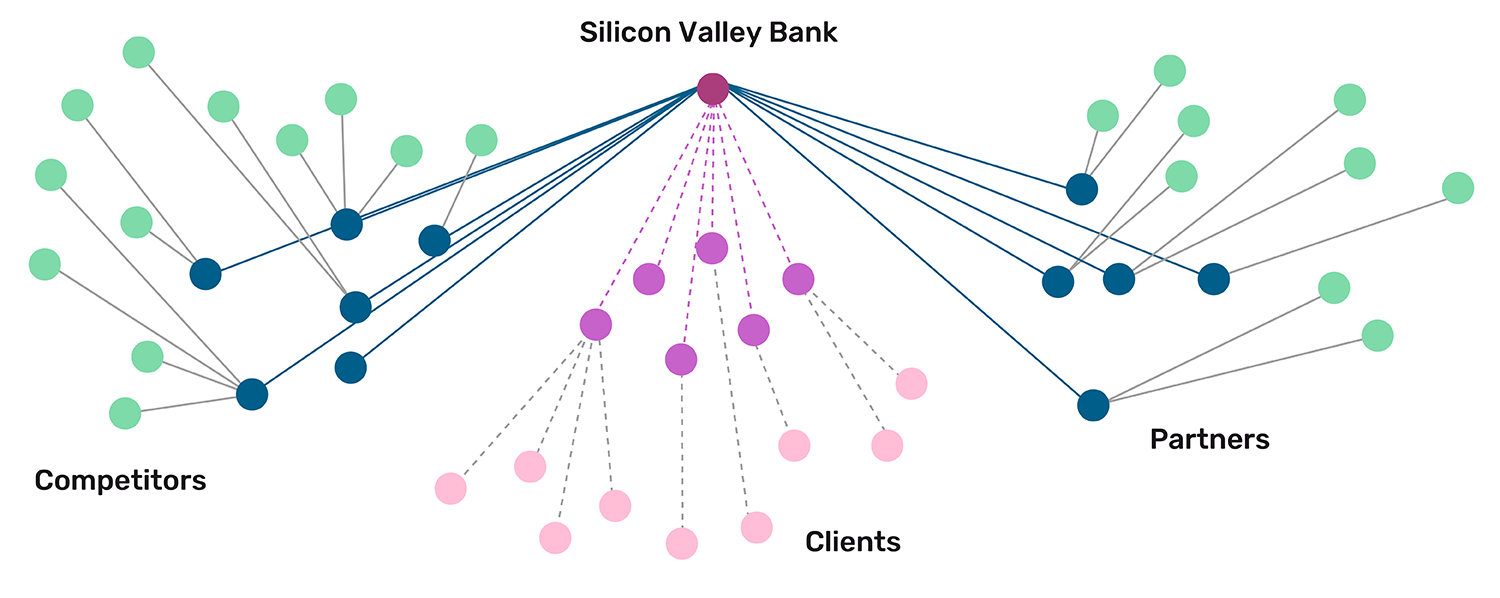
Source: Man Group. Schematic illustration. This analysis is provided for informational purposes only. It does not constitute investment advice and should not be construed as a recommendation to buy or sell any security.
All of these elements, which each form part of our ratings probability model, highlighted the likely downgrade of SVB ahead of the market.
Case study 2: Occidental Petroleum
Our downgrade probability model flagged Occidental Petroleum's precarious balance sheet following its acquisition of Anadarko Petroleum, for which it took on US$40 billion in debt. Specifically, our model assigned elevated downgrade probabilities based on the company's deteriorating leverage metrics and the collapsing oil price environment, as shown in Figure 6.
Moody's downgrade of Occidental Petroleum's senior unsecured debt from Baa3 to Ba1 pushed the company's bond rating into junk territory, triggering widespread index rebalancing and forced selling. The Permian Basin shale producer consequently became one of the largest fallen angels as it struggled to deal with a high debt load in the face of oil's crash.
For UK insurers operating under the Solvency II Matching Adjustment framework, the value of an early warning is particularly acute. Downgrades trigger immediate balance-sheet impacts because the regulatory fundamental spread (FS) moves mechanically with changes in credit quality and maturity.
Consider a hypothetical £50 million matching adjustment exposure in Occidental with 10 years of duration held in 2019. For a USD-denominated non-financial corporate bond at 10-year maturity, the Prudential Regulation Authority’s FS calibration jumps from 0.77% (77 basis points) at BBB to 1.60% at BB – an 83 bps increase on downgrade. This translates to a balance-sheet impact of approximately £4.15 million and a corresponding reduction in own funds. In addition to this, the credit capital charge could increase by approximately £4-6 million, depending on the insurer’s internal capital model.
By flagging Occidental's deteriorating credit profile ahead of the March 2020 rating action, our model has demonstrated its capacity as a tool to help risk managers avoid erosion in matching adjustment and potentially protect capital reserves during periods of acute market stress.
Figure 6. Alarm bells: deteriorating leverage metrics and collapsing oil price environment
Problems loading this infographic? - Please click here
Source: Man Numeric proprietary data. This analysis is provided for informational purposes only. It does not constitute investment advice and should not be construed as a recommendation to buy or sell any security.
Conclusion: a powerful complement to discretionary approaches
Man Group has been a pioneer in applying systematic, data-driven techniques to financial markets. Our latest joint research with Pension Insurance Corporation, Stanford University and SAS demonstrates the capability of a machine-learning based approach to modelling credit rating transition compared to traditional techniques. This is particularly compelling to insurance investors, given public credit exposure typically forms more than 50% of an insurer’s investment portfolio. Timely and consistent identification of these signals could not only complement discretionary investment processes but also seek to help to optimise portfolio management decisions.
1. ROC AUC is used to measure a model’s ability to distinguish between positive and negative cases. An AUC of 1.0 represents a perfect model, while an AUC of 0.5 indicates the model performs no better than random chance.
You are now leaving Man Group’s website
You are leaving Man Group’s website and entering a third-party website that is not controlled, maintained, or monitored by Man Group. Man Group is not responsible for the content or availability of the third-party website. By leaving Man Group’s website, you will be subject to the third-party website’s terms, policies and/or notices, including those related to privacy and security, as applicable.