Introduction
In any fast-paced business the Technology group and its associated application landscape tends to grow organically. Implementation teams are focussed on delivery, mergers happen and point solutions are implemented as stop-gaps to meet the ever-changing requirements of the business. If initiatives are not in place to track all of this, you are at risk of not being able to understand your application landscape and where the associated risks lie.
If management asked the question: “What are our most critical applications?” would you even have a definition for the word critical? This clearly highlights the need to better understand your application landscape and have a quantitative way of defining what is important and to whom. This article describes the journey we’ve been on at Man Group to model our application landscape: what’s gone well, what requires more work and some future use cases we hope to support.
Why do it?
So why would you want to spend time and effort designing and populating a rated model of your application landscape? There are a whole host of reasons why this is useful, but the easiest one to point to in the financial industry is regulation. Although there is no regulation stating that everybody should have a rated model of their application landscape, GDPR is an example of regulators expecting everybody to know where all their data is and what it’s used for. Without an application catalogue to start from, the amount of work required is doubled. Here at Man Group we are undergoing a programme of work to ensure that all critical application access across the company is correctly certified on a periodic basis, with applications being onboarded to the process prioritised by criticality. This would be much more difficult without a well-maintained and rated application catalogue. We are also aware of upcoming regulation regarding proof of Operational Resilience and the tools and techniques described in this article will form a pivotal role in meeting that requirement.
Tooling
The key requirements we had for a tool to support these activities were:
- Must be able to collect relational data;
- Must have a readable and writable API;
- Must be able to collect data from and display data to around 100 users;
- Should be SaaS (Software as a Service) to minimise support overhead.
Avolution Abacus was selected as the tool of choice because:
- The flexible graph database allows us to model both relational and hierarchical relationships between components;
- The OData based rest API is capable of both reading and writing all elements and relationships in the database;
- It has a web portal where the wider userbase can access and update data;
- The studio tool allows us to easily customise the model we are populating;
- Algorithms allow us to calculate weightings and update records.
Getting Started
Before we could create a rated application model there were a few things we needed to get right first:
- Define Application: This may sound a bit odd until you attempt to do it. We had to decide what was in scope, what applications were just parts of other applications and how far we needed to go with third party web portals. Eventually we decided to include everything that a user can access, with applications broken down by distinct identities and permission sets.
- Know our Applications: We needed to be sure that we had one distinct list of everything we consider to be an application.
- Application Owners: Every application needed a Technology professional assigned as responsible for ensuring the data regarding that application in the catalogue was correct.
- Basic Application Details Catalogue: What high level information is realistically available to collect about every application? (Many initiatives like this one fail because the initial data collection is too ambitious).
- Populate: We needed to get application owners to populate the basic application details catalogue for their allocated applications.
The product of this preliminary work looked something like this (although our actual dataset had well over 500 entries):
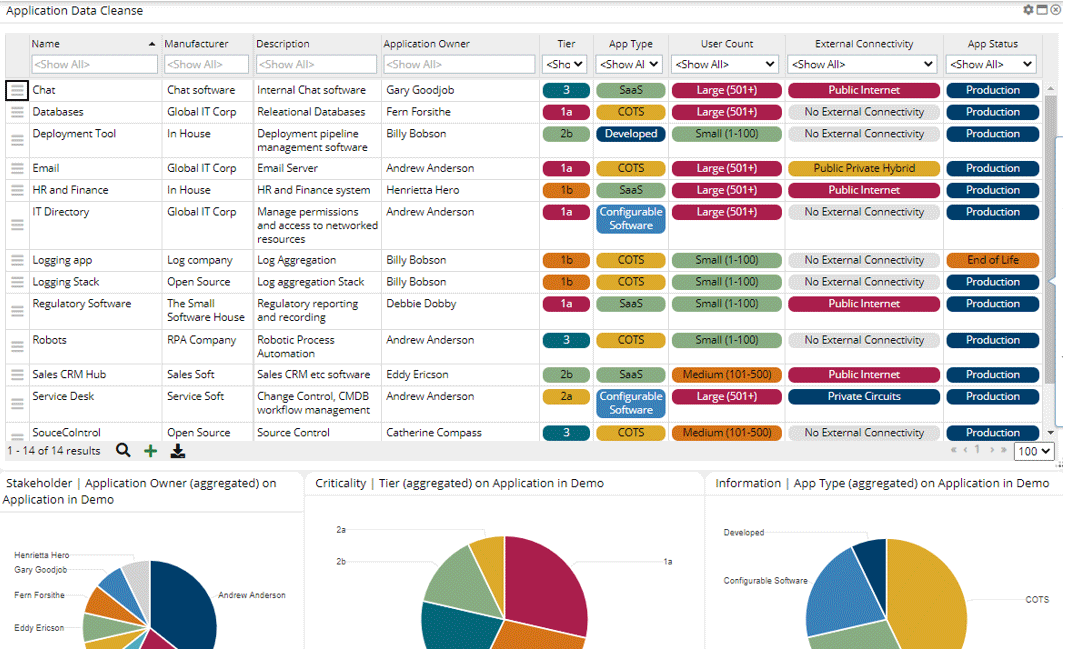
Source: Man Group. Illustrative example. For information only.
What Avoid When Populating a Dataset Manually:
- Collect every field imaginable
- Freeform Text
- Collect data you don’t have a use for
- Collect data you don’t have a source for
Modelling Criticality
As mentioned in the introduction, criticality is difficult to define. In the context of applications, it can be taken to mean importance. Different things are important to different people so the first part on the journey of understanding criticality is deciding what is important. Previously at Man Group the only ranking system we had was by Recovery Tier (i.e. how long can we operate without an application and how much data could we afford to lose in a disaster). Recovery and business continuity, however, is just one element that’s important to Technology. In recent years it’s become important to know the types of information or data a system holds; as this helps drive access restrictions and security policies, we can simply refer to this as Data Risk for the time being. The final dimension we’ve decided to capture at Man Group we are calling High Risk Activities (Activity Risk); we define these as activities that can be carried out in the application that carry risk (discounting activities specifically in place to mitigate risk).
To illustrate the types of results seen when applying these dimensions, and the fact that different applications can be important for different reasons, take a look at the table below:
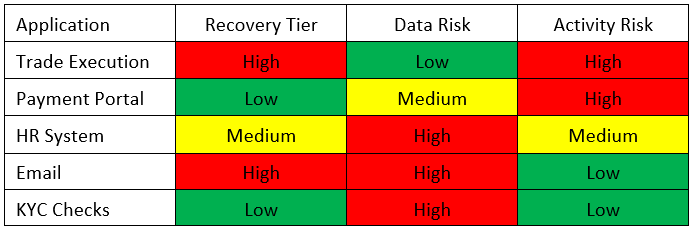
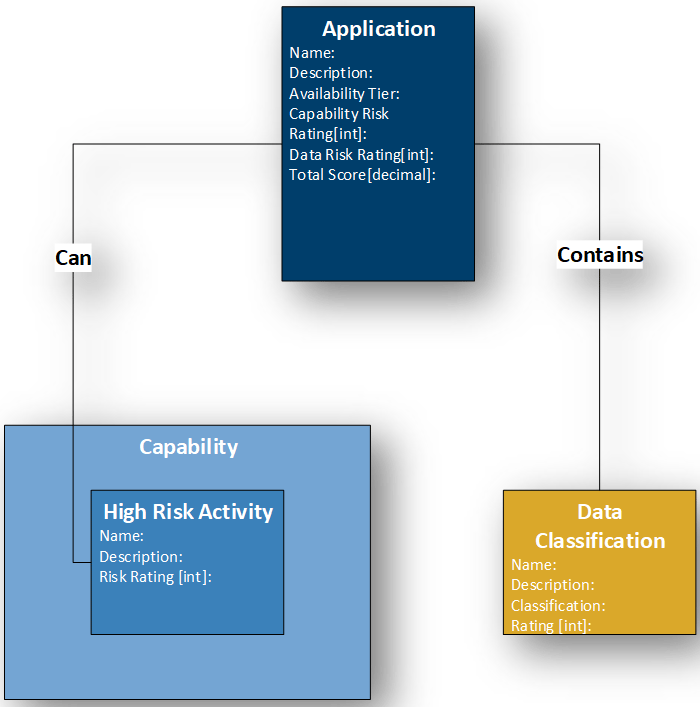
We knew that simply using high, medium and low rankings would not be sufficient. What is considered important with regard to the risk level associated with certain activities and regulation of certain data types can change year to year. What’s needed is not a subjective ranking of high, medium or low but an objective relationship to High Risk Activities and Data Classification Types. The High Risk Activities and Data Classification Types can then be scored based on what is important to us and those scores rolled up into the application.
The screenshots below give some examples of High Risk Activities, Data Classification Types and their associated rankings. We actually have 38 High Risk Activities, weighted and broken down by Capability Group, and 49 data classifications.
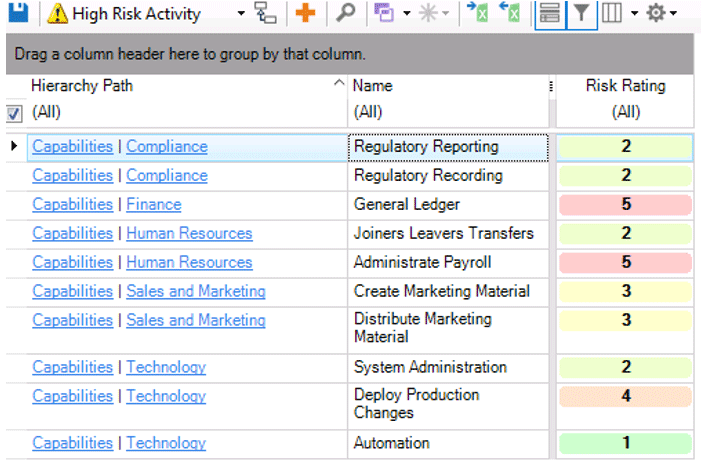
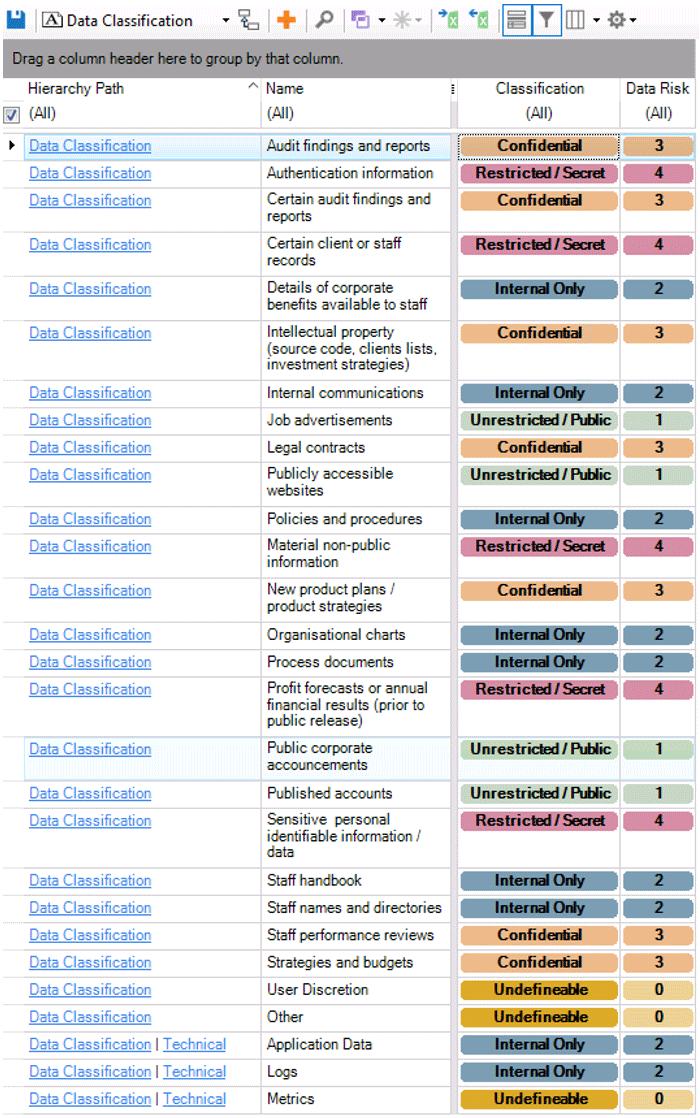
Source: Man Group. Illustrative example. For information only.
The model so far can be visualised as follows:
Source: Man Group. Illustrative example. For information only.
After defining and modelling our 3 dimensions of interest (Recovery Tier, Data Classification Types, High Risk Activities), we needed to decide how to combine them into a total score that we call criticality.
Recovery Tier is the easiest to deal with as it’s a single ranking. We have a 5 tier system which we correlated with numbers 6 to 1 (1 representing No Tier Required).
Data Classification Types are interesting as the level of concern (or weighting) has a maximum of Highly Restricted and a minimum of Public, but data sets within applications contain a mix of Data Classification Types. We decided that the highest-ranked data classification type assigned to an application is what is pertinent and that the variety of types has no baring on how that application should be treated. For this reason, the weighting is derived from the Maximum Data Classification Type associated with the application.
The opposite can be said regarding High Risk Activities. The more High Risk Activities an application can perform the higher the risk associated. For that reason, we decided to take sum of the weightings from the associated High Risk Activities.
What we are then left with is:
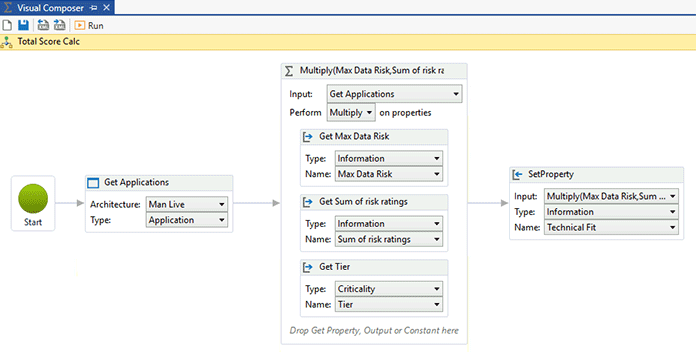
Total Score = Recovery Tier × MAX (Data Classification Type) × ∑(High Risk Activities)
Using the Visual Algorithm Editor in Abacus Cloud we can calculate this for all applications on a scheduled basis.
Maximum Data Rating:

Source: Man Group. Illustrative example. For information only.
Sum of the Risk Ratings:

Source: Man Group. Illustrative example. For information only.
Multiply the Risk, Data and Availability Ratings
Source: Man Group. Illustrative example. For information only.
The advantage of using such a model is that the majority of the manual work put in to ranking applications has been in gathering factual data, which is then used to calculate rankings. What this means is that if priorities change, we can simply change the weightings or the calculation with ease. It’s also straightforward to expand the model to have different weightings or calculations for different stakeholders. For example, the Information Security Team may not be interested in Recovery Tier so would want a score calculated by Data Classification Types and High Risk Activities, which is easily achievable without having to re-gather information.
Calibrating your model
Chances are your department has institutional knowledge of what it considers critical applications. Rather than discarding this, it can be used to tweak weightings of activities and data types until institutional knowledge and the model bare some resemblance. You’ll also find some things you didn’t realise were important. What you’ve effectively done is model your department’s value system in a way that can be applied to all applications, including anything that may come along in the future.
Moving Forward
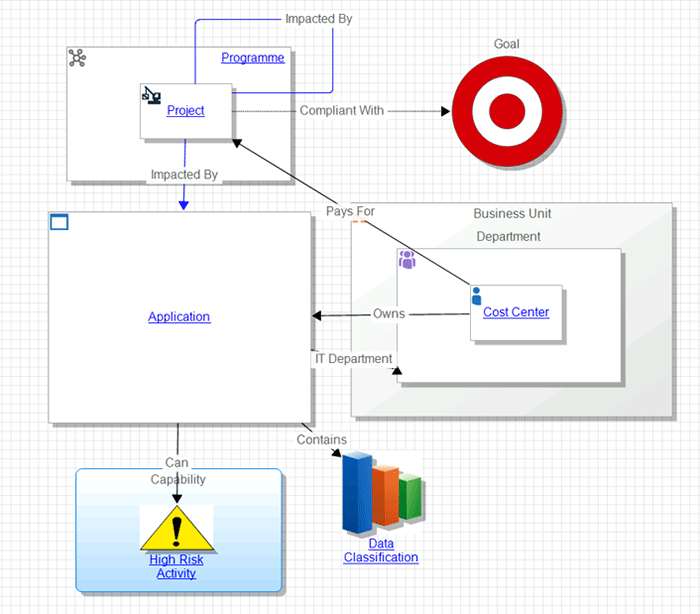
What this article has covered so far is a very small part of what you could potentially populate in an Enterprise Architecture Repository. The out-of-the-box metamodel we selected comes with over 40 component types and a similar number of ways of connecting them; that’s just one of the 100+ starting metamodels to choose from. The scope of what can be modelled needs to be prioritised based on requirement and ease of execution.
The following diagram gives an illustration of what components and connections are populated in Abacus so far:
Source: Man Group. Illustrative example. For information only.
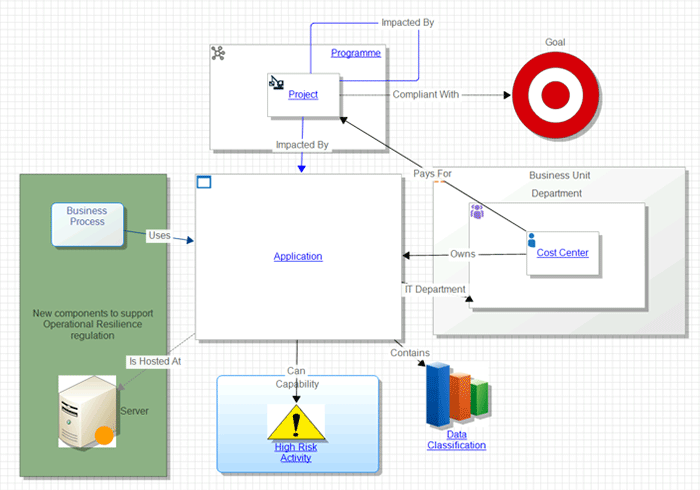
An example of how we might expand this Metamodel to support the upcoming Operational Resilience is as follows:
Source: Man Group. Illustrative example. For information only.
Keeping everything up to date
One of the biggest challenges around modelling your IT landscape is keeping everything up to date. In order to do that we are in the process of employing a two-pronged approach:
1. Crowd sourcing
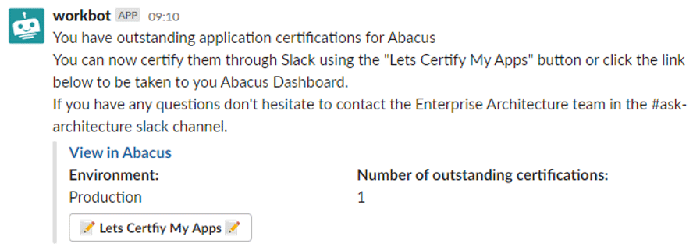
Application Owners are responsible for the basic data the system holds regarding their applications. For a large subset of these applications we require Application Owners to certify that the information in the most important fields is correct. This is done quarterly. We’ve recently utilised our Integration as a Service Platform, Workato, to drive this certification through Slack (Man Group’s strategic communication application):
What is Workato
Workato is a next-generation, cloud-based integration and automation platform. At Man Group we are currently using it to tie together IT Systems of record and drive workflows through Slack.
2. Integrations and automation
We never intended Abacus to be a primary system of record as it’s most powerful when it’s populated with high-level information from other systems of record. Our future plans mainly focus around what data can be brought in and how it can be linked with other information. This includes data on: business processes, cost centres, org chart, servers and deployments. Using Workato we can connect to anything with an API (cloud or on premises) and direct that information into Abacus either automatically or incorporated into workflows.
Summing Up
At Man Group our core business model relies on our ability to take all manner of data and model them to find opportunities in financial markets and beyond. We are now starting to realise the value in taking that approach with our internal data beyond just cataloguing and budgets. Using Abacus to support this model, we are gleaning new insights into what is important to technical and managerial stakeholders alike. Those insights can be calibrated to suit the scenario under consideration, then drive decision making. Furthermore, we have the flexibility to pivot as priorities, regulation and times change.
You are now leaving Man Group’s website
You are leaving Man Group’s website and entering a third-party website that is not controlled, maintained, or monitored by Man Group. Man Group is not responsible for the content or availability of the third-party website. By leaving Man Group’s website, you will be subject to the third-party website’s terms, policies and/or notices, including those related to privacy and security, as applicable.