Key takeaways:
- April 2025 witnessed one of the steepest and sharpest rebounds of the last 25 years
- While it was a challenging month for Man TargetRisk, our analysis of V-shaped recoveries since 2000 does not suggest that we are witnessing a broader, structural shift toward more frequent market snapbacks
- We maintain that risk-managed strategies can help mitigate severe losses, support long-term compounding and allow for greater exposure during times of market stability
Introduction
‘Buy the dip’ is a popular mantra in certain investment circles, fuelled by several views: the belief that the Federal Reserve (Fed) will intervene in the event of a serious downturn, conviction in AI's economic growth potential, and the observation that markets have recently swiftly recovered losses. In stark contrast to the ‘buy the dip’ approach, risk-managed strategies are designed to help mitigate catastrophic losses and may often reduce exposure in sharp market sell-offs. In some instances, when risk spikes but losses do not materialise, these safeguarding mechanisms can become a drag on portfolio performance.
The events of April 2025, when the S&P 500 plunged more than 10% in the first six trading sessions, only to recoup almost all of its losses by the end of the month, might be seen as validation of the ‘buy the dip’ approach. For us, it was a reminder of markets’ underlying nervousness and the unpredictability of returns, underscoring the need for a risk-balanced approach. History has shown us that not all market corrections are short-lived. A small sell-off can precede a major fall in equity markets, as occurred in 2008 and 2020. In these instances, buying the dip would have resulted in catastrophic losses.
But is the current environment materially different? This is a question we are increasingly asked, reflecting concerns that post-COVID market dynamics and heightened policy uncertainty will be characterised by more V-shaped recoveries. In this paper, we address these worries by examining the April 2025 rebound in the context of V-shaped recoveries since 2000. We also study the impact of the recent rebound on Man TargetRisk (TargetRisk) and reiterate the potential benefits of a risk-managed approach over the long term.
April 2025 recovery: outlier or sign of a structural shift?
To analyse V-shaped recoveries, we first need clear criteria to identify them. We examine cumulative daily returns for the MSCI World since 2000 across all one‐month (defined as overlapping 21-day) periods. In each period, we identify the lowest point of cumulative return and then identify the maximum values before and after that point. We then define the depth of the V-shaped recovery as the difference between the lower of the two maximum values and the minimum point, as illustrated below.
Figure 1. Defining a V-shaped recovery

Schematic illustration. Source: Man Group, as of May 2025.
Figure 2 plots the deepest V-shaped recoveries in the MSCI World since 2000 by selecting the most pronounced reversal each year. It shows that April 2025 was among the steepest and sharpest moves to date, comparable to those V-shaped recoveries seen during major market downturns, including the dot-com bust, Global Financial Crisis (GFC) and COVID.
Figure 2. Maximum V-shaped recovery over one month by year for MSCI World since 2000
Problems loading this infographic? - Please click here
Date range: Jan 2000 – April 2025. Source: Internal Man Group Databases, Bloomberg.
Have V-shaped recoveries become more frequent?
Next, we examine one-month V-shaped recoveries of at least 5% (excluding overlaps) since 2000. The top chart in Figure 3 displays the MSCI World’s cumulative returns, with qualifying one-month recoveries highlighted in pink. The bottom chart shows the rolling five-year average number of events per year.
Figure 3. MSCI World returns, highlighting 5% V-shaped recoveries in one month

Date range: Jan 2000 – Apr 2025. Source: Bloomberg, Man Group Internal Databases.
While V-shaped recoveries occur more frequently amid heightened market volatility, our analysis shows that they emerge across various market environments: during prolonged downturns (2001–2003), following marked corrections (2009 and 2020), and even within sustained bull market phases (2006 and 2014). Although April 2025's V-shaped recovery was notable for its speed and depth, Figure 3 does not suggest it was indicative of a broader, structural shift toward more frequent rapid rebounds.
V-shaped recoveries and TargetRisk
Let us now turn to the impact of V-shaped recoveries on TargetRisk, looking first at its total returns during these V-shaped events (as defined above). In each of these periods, equity market returns were near zero. However, returns to other asset classes and the behaviour of the strategy mean that TargetRisk outcomes will vary.
Figure 4. TargetRisk returns in MSCI World V-shaped recoveries (5% in one month)
Problems loading this infographic? - Please click here
Date Range: Jan 2000 – Apr 2025. Source: Bloomberg, Man Group Internal Databases. Past performance is not indicative of future returns.
On average, V-shaped recoveries are not bad for TargetRisk – outcomes are generally between -4% and +4% and centre around zero. Through this lens, April 2025 appears to be a significant outlier, as shown in Figure 4.
Understanding TargetRisk’s reaction
TargetRisk is designed with the aim of generating improved performance while maintaining a stable volatility profile across market conditions. Its foundation is volatility scaling – a dynamic mechanism that adjusts exposure inversely to market volatility. When volatility rises, exposure is reduced; when markets calm, exposure increases, helping investors maintain their desired risk profile.
In addition, and to mitigate against severe drawdowns, TargetRisk incorporates risk overlays that can rapidly reduce exposure when market stress exceeds certain thresholds. As we have previously discussed, these overlays act as circuit breakers, intending to help shield portfolios from catastrophic losses during prolonged disruptions.
While reducing exposure as volatility and loss risks increase may help limit deep losses that impair compounding, there is a trade-off. In rapid market rebounds, reduced exposure can lead to underperformance, as seen in April 2025. Balancing these risk management benefits against the potential costs is essential.
How do you weigh protection against cost?
It is important to acknowledge that V-shaped recoveries can only be identified in hindsight. Figure 5 identifies the instances since 2000 when the MSCI World fell by at least 5% in a week and shows the returns over the subsequent three weeks (excluding overlapping periods).
Figure 5: MSCI World: distribution of subsequent three-week returns (following initial one-week loss of more than 5%)
Problems loading this infographic? - Please click here
MSCI World represented by MSCI World Net Total Return. Date range: Jan 2000 – Apr 2025. Source: Bloomberg, Man Group Internal Databases. Past performance is not indicative of future returns. Indices are unmanaged, and performance is shown gross of fees. One cannot invest directly in an index.
The mean of the distribution was slightly positive, meaning that on average there is a small cost to reducing risk in stress environments. However, there were also some significantly negative outcomes when equities fell by an additional 15-20% in subsequent weeks.
Figure 5 also offers perspective on the April 2025 market correction, where the MSCI also fell by over 5% in less than a week. Volatility spiked and prices fell in the face of the most significant shock to global trade since COVID, compounded by increased uncertainty about US economic policy that brought into question the safe-haven status of US Treasuries. Without significant intervention, markets were poised for catastrophic losses. TargetRisk recognised this and cut exposure.
As we all now know, a significant intervention was made. Tariffs were delayed and within a month, equity markets recovered their losses. The shape of the market movement – deep and fast relative to history – was particularly difficult for both volatility targeting and our overlays.
Analysing the impact
We assess TargetRisk's dynamic components by comparing its performance against a three-year moving average of its holdings, scaled to the same level of volatility. This approach isolates the added value of dynamic adjustments from our core risk allocations while allowing the portfolio to adapt to different volatility regimes.
Figure 6 shows the return differential between these two approaches. The navy blue line represents the overall difference, which we break down into periods of one-month V-shaped recoveries of at least 5% (pink) and all other times (aqua blue). The pink line indicates that our volatility scaling and overlay mechanisms tend to detract from performance during V-shaped recoveries.
Figure 6. TargetRisk historical simulated outperformance over rolling three-year positions (volatility matched)
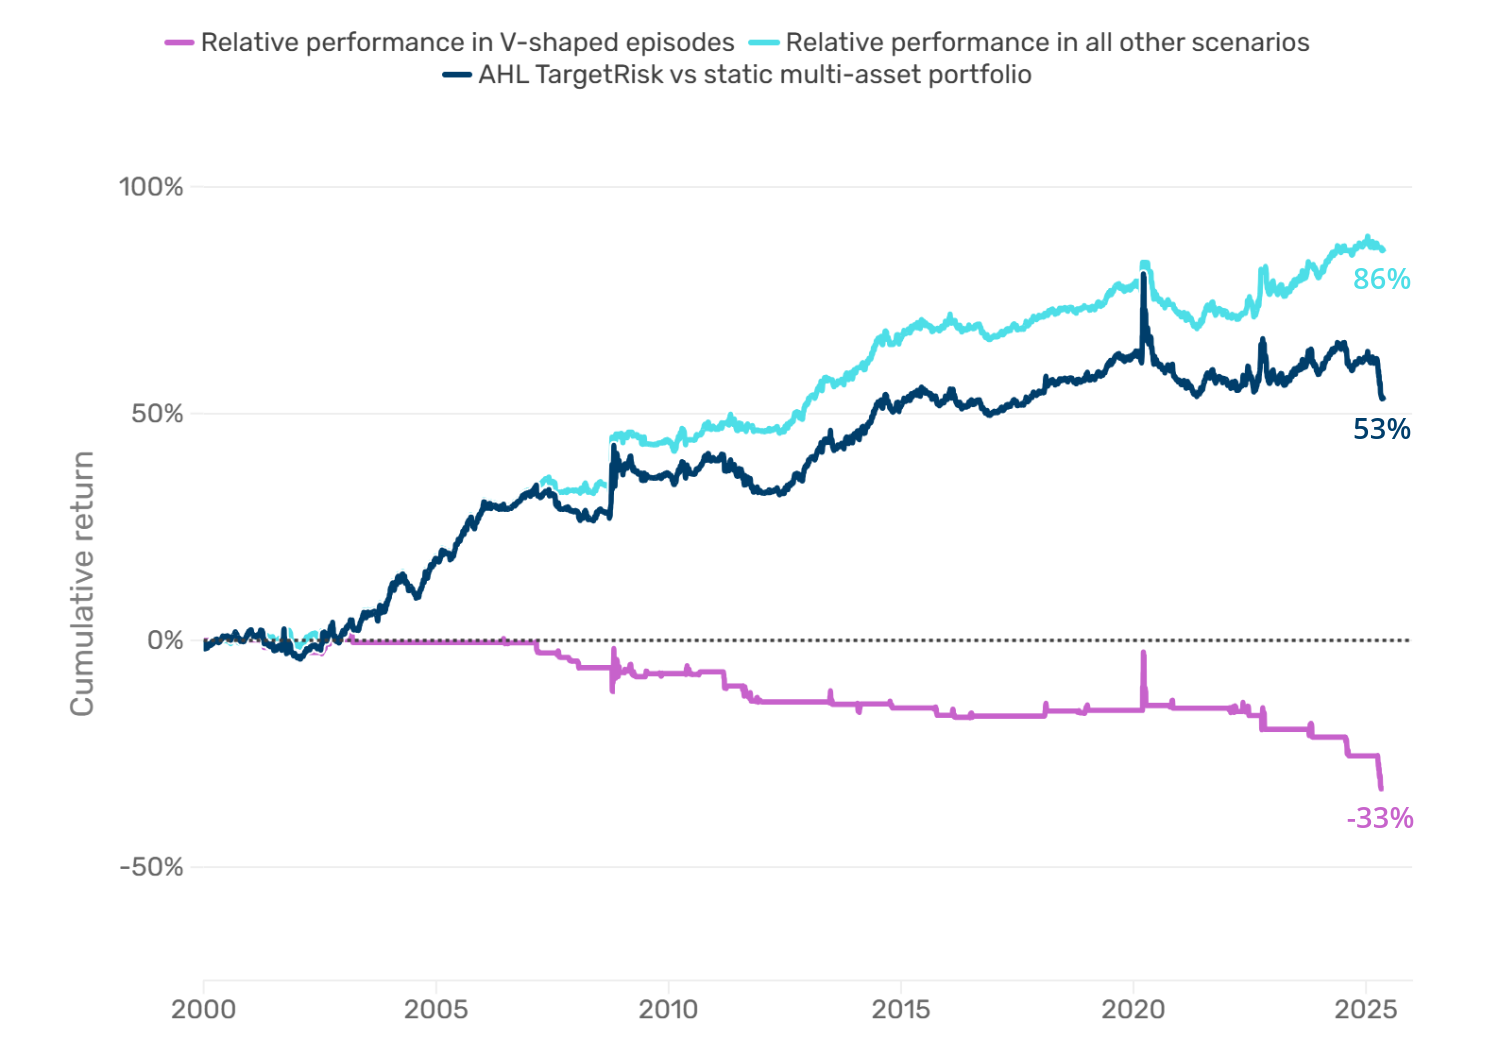
Based on live and volatility-scaled simulated data from 2000. Date Range: Jan 2000 – Apr 2025. Source: Bloomberg, Man Group Internal Databases. Past performance is not indicative of future returns.
However, in other periods, our dynamic processes have added value. Avoiding the depths of losses in the GFC and COVID was incredibly valuable from a compounding point of view, particularly given endured losses in other parts of clients’ portfolios at these times.
Reducing exposure as a way to help limit losses in these periods also allows the portfolio to carry more exposure in most other times. The aqua blue line is consistently upward-sloping because the volatility scaling can increase exposure when markets are stable to compensate for the lack of exposure when volatility spikes. We see this as a worthwhile trade-off.
Is it different this time?
With all the above said, there are lingering questions about whether the current environment is unique relative to history. Given the US administration’s appetite for bold policy approaches and reversals, some investors are concerned that there may be more V-shaped recoveries in the near future. While this is certainly a possibility, it is dependent on some assumptions.
First, it assumes that markets do not adapt to new information. More specifically, reversals on broad-based reciprocal tariffs, Fed independence and China-specific tariffs mean market participants now have to price in the probability of policy U-turns. This is expected to lead markets to react less negatively to bold policy movements, thus creating lower risk of V-shaped recoveries.
Second, it assumes that these announcements can be effectively rolled-back. While any policy can technically be reversed, markets dislike such uncertainty. Financial theory suggests that when markets face repeated dramatic policy shifts, investors should demand higher risk premiums to hold assets, pushing prices lower. Continued V-shaped recoveries would suggest that the market is persistently agnostic to this risk.
We do not discount the prospect of increased volatility in markets, including further V-shaped recoveries. However, we strongly believe that markets are likely to incorporate the information available to them and adjust their reaction function accordingly.
Parting thoughts
April 2025 was a challenging month for TargetRisk. Our dynamic risk management process cut exposure in response to the significant risk presented by the ‘Liberation Day’ tariff announcement and thus failed to participate in the subsequent market rally. This V-shaped market return highlighted the cost of our risk management process and raised questions about its relevance in the current market environment.
Our empirical study of V-shaped recoveries since 2000 shows that they have occurred throughout history. Although April 2025 stands out for the depth of the V (which is comparable to the GFC and COVID) and the speed of the recovery (which was unusually fast), we do not see evidence that we are in a materially different environment where V-shaped recoveries are becoming more frequent.
While we are not complacent, we remain confident in our risk management approach. We maintain our conviction that mitigating against severe losses can support long-term compounding and allows for greater exposure during times of market stability.
Investment policy of Man TargetRisk
Short description
The Fund aims to generate capital growth over the medium to long term by providing dynamic exposure to a range of assets and a return stream with a stable level of volatility regardless of market conditions. The Fund will apply its proprietary quantitative model to adjust the exposure to particular positions and achieve its investment objective. The position sizing (exposure) is based on a systematic algorithm that adjusts the notional amount of each position based on the risk of the Portfolio. The strategy utilises additional systematic overlays to control downside risk. The Fund's exposure to different investments is determined in accordance with formulas used by its computer-based model using various techniques, including 'volatility scaling'. According to this technique, a particular market's volatility is measured; if the market is turbulent and returns are volatile, the Fund's exposure to that market will be reduced. Exposure will be increased where a market is calm.
Type of assets
The Fund's objective will be achieved primarily through the use of financial derivative instruments and stable risk exposure to equities, fixed income, money market instruments, bank deposits and other liquid assets including cash, cash equivalents and liquid government debt instruments. It may also invest in futures, forwards, swaps, swaptions and contracts for difference.
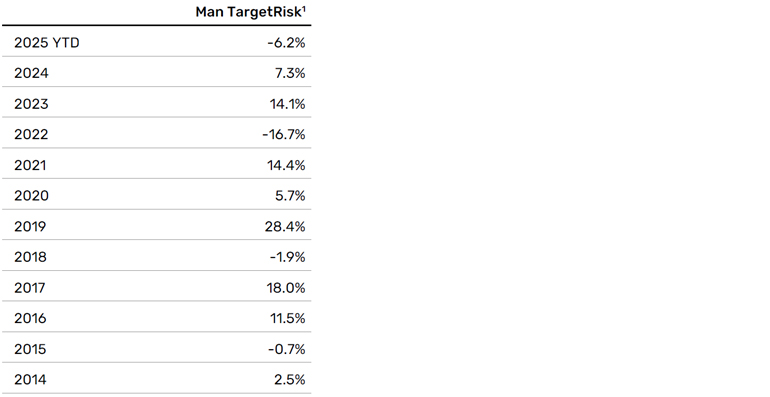
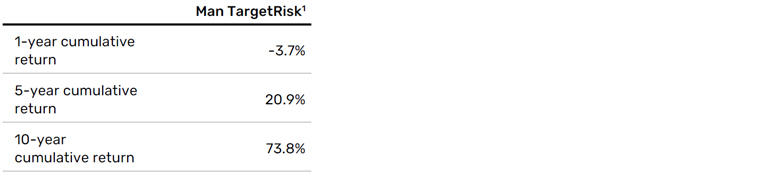
1. Please note that the performance data is not intended to represent actual past or simulated past performance of an investment product. The data is based on a representative investment product or products that fully invest in Man TargetRisk. Man TargetRisk is net of estimated fees and service cost of 0.95%.
Prior to December 2014, the performance, volatility, exposure and/or other information on Man TargetRisk is simulated. The simulation has been created by ‘back testing’ a systematic trading model to historic data. The synthetic track record is subject to change without notice as models develop over time. The performance results provided herein were based on simulations with trading costs estimated using internal slippage models. This approach has inherent limitations, including that results may not reflect the impact material economic and market factors might have had on the investment manager’s decision-making had the strategy been managed throughout the period over which the simulated performance is illustrated.
Important considerations
One should carefully consider the risks associated with investing, whether the Fund suits your investment requirements and whether you have sufficient resources to bear any losses which may result from an investment:
Investment Objective Risk - There is no guarantee that the Fund will achieve its investment objective.
Market Risk - The Fund is subject to normal market fluctuations and the risks associated with investing in international securities markets and therefore the value of your investment and the income from it may rise as well as fall and you may not get back the amount originally invested.
Counterparty Risk - The Fund will be exposed to credit risk on counterparties with which it trades in relation to on-exchange traded instruments such as futures and options and where applicable, ‘over-the- counter’("OTC", "non-exchange") transactions. OTC instruments may also be less liquid and are not afforded the same protections that may apply to participants trading instruments on an organised exchange.
Currency Risk - The value of investments designated in another currency may rise and fall due to exchange rate fluctuations. Adverse movements in currency exchange rates may result in a decrease in return and a loss of capital. It may not be possible or practicable to successfully hedge against the currency risk exposure in all circumstances.
Liquidity Risk - The Fund may make investments or hold trading positions in markets that are volatile and which may become illiquid. Timely and cost efficient sale of trading positions can be impaired by decreased trading volume and/or increased price volatility.
Financial Derivatives - The Fund will invest financial derivative instruments ("FDI") (instruments whose prices are dependent on one or more underlying asset) to achieve its investment objective. The use of FDI involves additional risks such as high sensitivity to price movements of the asset on which it is based. The extensive use of FDI may significantly multiply the gains or losses.
Leverage - The Fund's use of FDI may result in increased leverage which may lead to significant losses’
Model and Data Risk - The Investment Manager relies on quantitative trading models and data supplied by third parties. If models or data prove to be incorrect or incomplete, the Fund may be exposed to potential losses. Models can be affected by unforeseen market disruptions and/or government or regulatory intervention, leading to potential losses.
Important Information
This material is of a promotional nature.
The Fund is a sub-fund of Man Funds VI plc, domiciled in Ireland and registered with the Central Bank of Ireland. Full details of the Fund's objectives, investment policy and risks are located in the Prospectus which with the Key Investor Information Document (KIID) / Key Investor Document (KID),and the Report and Accounts of the UCITS, are accessible free of charge from the local information/paying agent, from authorised distributors and from www.man.com/documents. The KIID/KID is available in English and in an official language of the jurisdictions in which the Fund is registered for public sale. The Prospectus and the Reports and Accounts of the UCITS can be obtained in English. In Switzerland, the Prospectus is also available in German.
In order to fulfil the fund's objectives the Prospectus allows the manager the ability to invest principally in units of other collective investment schemes, bank deposits, derivatives contracts designed with the aim of gaining short term exposure to an underlying stock or index at a lower cost than owning the asset, or assets aiming to replicate a stock or debt securities index.
More than 35% of the Fund's total holdings in bonds may be issued by or guaranteed by:
• EU and OECD Governments
• European Investment Bank
• International Financing Corp
• World Bank
The value of an investment and any income derived from it can go down as well as up and investors may not get back their original amount invested. Alternative investments can involve significant additional risks.
For a summary of investor rights please see www.man.com/investor-relations and for guidelines for individual or collective redress mechanisms, please consult the fund’s prospectus and its key information document, as well as the complaints handling policy found here www.man.com/complaints-handling-policy.
This material is for information purposes only and does not constitute an offer or invitation to invest in any product for which any Man Group plc affiliate provides investment advisory or any other services. It is not contractually binding nor does it represent any information required by any legislative provision.
Opinions expressed are those of the author as of the date of their publication, and are subject to change.
Some statements contained in these materials concerning goals, strategies, outlook or other non-historical matters may be "forward-looking statements" and are based on current indicators and expectations at the date of their publication. We undertake no obligation to update or revise them. Forward-looking statements are subject to risks and uncertainties that may cause actual results to differ materially from those implied in the statements.
Distribution of this material and the offer of shares may be restricted and the minimum subscription amount may be higher in certain jurisdictions. The product(s) mentioned within this material (i) may not be registered for distribution in your jurisdiction, and (ii) may only be available to professional or otherwise qualified investors or entities. It is important that distributors and/or potential investors are able to ensure compliance with local regulations prior to making a subscription. Please refer to the offering documentation for additional information.
Unless stated otherwise the source of all information is Man Group plc and its affiliates as of the date on the first page of this material.
This material was prepared by AHL Partners LLP ("Investment Manager") (company number OC380907) which is registered in England and Wales at Riverbank House, 2 Swan Lane, London, EC4R 3AD. Authorised and regulated in the UK by the Financial Conduct Authority. This material is distributed pursuant to global distribution and advisory agreements by subsidiaries and consultants of Man Group plc ("Marketing Entities").
Switzerland: To the extent the material is made available in Switzerland the communicating entity is:
For Clients (as such term is defined in the Swiss Financial Services Act): Man Investments (CH) AG, Huobstrasse 3, 8808 Pfäffikon SZ, Switzerland. Man Investment (CH) AG is regulated by the Swiss Financial Market Supervisory Authority ('FINMA'); and
For Financial Service Providers (as defined in Art. 3 d. of FINSA, which are not Clients): Man Investments AG, Huobstrasse 3, 8808 Pfäffikon SZ, Switzerland, which is regulated by FINMA.
The Fund has been registered for offering to non-qualified investors with FINMA. The Swiss representative is Man Investments AG. The Swiss paying agent is RBC Investor Services Bank S.A., Esch-sur Alzette, Zurich Branch, Badenerstrasse 567, P.O. Box 1292, CH-8048 Zurich, Switzerland. TheProspectus / Offering Memorandum, the Key Investor Information Document,the Articles of the Fund and the annual financial statements of the Fund may be obtained free of charge from the Swiss Representative. In respect of the Shares distributed / offered in or from Switzerland, the place of performance and the place of jurisdiction are at the registered office of the Swiss Representative in Switzerland.
Recipients of this material are deemed to be investment professionals and/or qualified investors that have employed appropriately qualified individuals to manage their financial assets and/or are a financial services entity appointed by an investor to provide fiduciary advisory and/or portfolio management services in respect of their financial assets. Information provided in response to queries regarding investment strategies and products managed by the Investment Manager will not be deemed to be provision of investment advice or personal investment recommendations, or assessment of the suitability or appropriateness of any investment products or consideration of the particular circumstances specific to any individual recipient to whom this material has been sent.
If you wish to complain please contact MAMIL ('The Manager') to obtain a copy of the complaints procedure which is available in English. If you are not satisfied with the final response resolution you may be able to refer your complaint to an Alternative Dispute Resolution Authority (ADR). For more information please refer to man.com/contact. Alternatively, in the EEA, you can find more information about local ADRs and find a complaint form in your local language on the Financial Dispute Resolution network (FIN-NET) section of the European Commission website.
Please note that at any time the Manager or the Management company retains the right to terminate arrangements for the marketing of this product.
This material is not suitable for US persons.
This material is proprietary information and may not be reproduced or otherwise disseminated in whole or in part without prior written consent. Any data services and information available from public sources used in the creation of this material are believed to be reliable. However accuracy is not warranted or guaranteed. © Man 2025
You are now leaving Man Group’s website
You are leaving Man Group’s website and entering a third-party website that is not controlled, maintained, or monitored by Man Group. Man Group is not responsible for the content or availability of the third-party website. By leaving Man Group’s website, you will be subject to the third-party website’s terms, policies and/or notices, including those related to privacy and security, as applicable.