Currently almost 60% of the Global High Yield bond market trades at a credit spread of under 300 basis points, as measured by the ICE BofA Option-Adjusted Spreads (OAS)1. Any passive strategy that tracks an index, or those offered by managers that tightly hug a benchmark index, is therefore probably full of expensive paper which offers inadequate compensation for the underlying credit risk.
That said, whilst a large chunk of the market may be keenly priced, the high level of dispersion present in certain sectors suggests that there are still ample opportunities to capture mispricing.
We have calculated this by using all corporate sectors of the ICE BofA Global High Yield index (HW00)2. This is the most representative benchmark of the HY sector. Each chart plots the OAS (option adjusted spread) to examine the valuations across different sectors.
The following chart depicts the level of dispersion across sectors in the high yield universe, as measured by the interquartile range of the credit spreads of bonds within the sector.
Figure 1. High Yield non-financial sectors ordered in terms of dispersion (interquartile range of OAS)
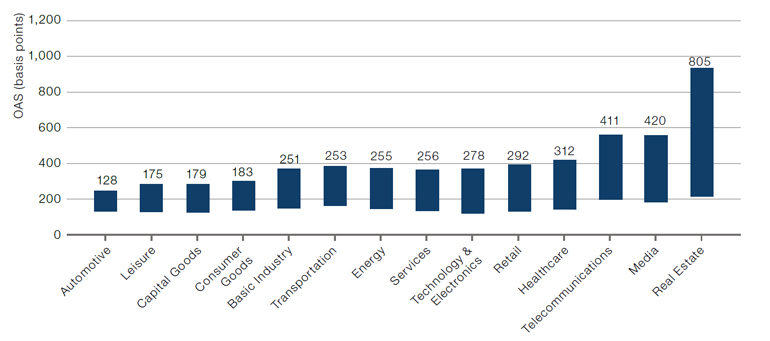
Source: Man GLG, ICE Indices OAS as of 19 January 2024.
Interestingly, cyclical sectors, which one may expect to exhibit more dispersion in an era of high interest rates and slowing growth, actually display relatively little in terms of pricing differentiation. Whereas, telecommunications, typically viewed as a more resilient non-cyclical sector, has an interquartile range of over three times more than automobiles. The standout is of course real estate, with a dispersion level that offers twice the overall option-adjusted spread (OAS) than the market as a whole. To us, this implies that there is a lot of mispricing going on within these areas which can present active managers — who can properly assess fundamentals and are not passively tracking an index — with opportunities to exploit.
Taking this a step further and looking at pure valuations, the following chart displays overall valuations (in terms of OAS) of industrial sectors at present versus just over 12 months ago. Whilst spreads have contracted across most areas, we can still observe that most sectors typically viewed as cyclical - such as leisure, retail and consumer goods — all have average spreads of 400 basis points or lower.
Figure 2. Non-financial sector spreads in 2024
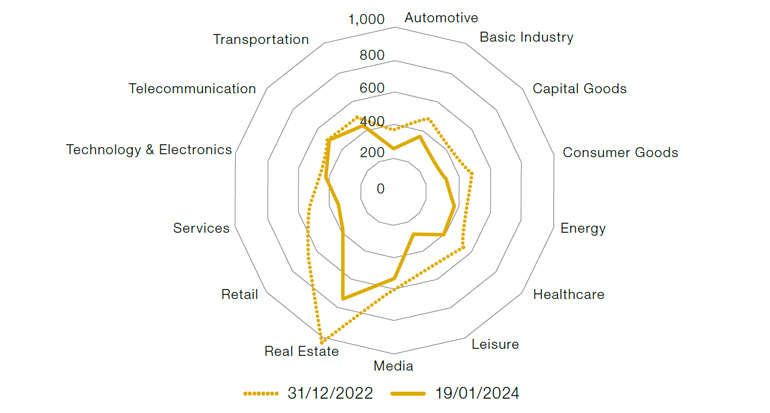
Source: ICE Indices (HW00) OAS spread levels as at 31/12/2022 and 19/01/2024.
Real Estate continues to be the one sector where valuations are more reflective of the pain of higher rates, perhaps due to the more direct linkage between commercial mortgages and underlying interest rates compared to other sectors. The underlying strength of the consumer, in terms of savings and overall disposable income, may also have contributed to less dispersion being observed in other sectors.
At this stage of the credit cycle, we believe that corporate sector sensitivities to cyclicality are not fully reflected in valuations, aside from real estate. Hence why we focus on idiosyncratic opportunities as opposed to broad beta plays.
With contributions from Jon Lahraoui, Director, Credit Man GLG.
1. The ICE BofA Option-Adjusted Spreads (OASs) are the calculated spreads between a computed OAS index of all bonds in a given rating category and a spot Treasury curve. An OAS index is constructed using each constituent bond's OAS, weighted by market capitalisation.
2.
ICE BofA Global High Yield Index (HW00) ICE BofA Global High Yield Index tracks the performance of USD, CAD, GBP and EUR denominated below investment grade corporate debt publicly issued in the major domestic or eurobond markets. https://indices.ice.com/
ICE BofA Option-Adjusted Spreads and ICE Bofa High Yield Index (HW00) a product of ICE Data Indices, LLC and are used with permission.
ICE® is a registered trademark of ICE Data Indices, LLC or its affiliates and BofA® is a registered trademark of Bank of America Corporation licensed by Bank of America Corporation and its affiliates (“BofA”), and may not be used without BofA’s prior written approval. The index data referenced herein is the property of ICE Data Indices, LLC, its affiliates (“ICE Data”) and/or its third party suppliers and, along with the ICE BofA trademarks, has been licensed for use by Man Group. ICE Data and its Third Party Suppliers accept no liability in connection with the use of such index data or marks. See https://www.ice.com for a full copy of the Disclaimer.
You are now leaving Man Group’s website
You are leaving Man Group’s website and entering a third-party website that is not controlled, maintained, or monitored by Man Group. Man Group is not responsible for the content or availability of the third-party website. By leaving Man Group’s website, you will be subject to the third-party website’s terms, policies and/or notices, including those related to privacy and security, as applicable.