“Be fearful when others are greedy and greedy when others are fearful.”
A glance at the Fear & Greed Index, used to gauge the current mood of the market, brings this well-known quote from Warren Buffett to mind. The Index has moved from “fear” just over a year ago, to “greed” in November 2023, and is now close to “extreme greed” mode.1
Digging into the index’s underlying indicators, it’s worth noting that four of the seven inputs are pointing to “extreme greed” (including market momentum, stock price strength, stock price breadth and junk bond demand) while the put/call ratio points to “greed”. The only inputs that are keeping the index from what could be all-time extreme greed level are market volatility, which is at “neutral” but trending towards greed with the low level of the VIX, and the demand for safe haven assets which is currently registering “neutral”. The latter should be taken with a pinch of salt with US Treasury bond yields as elevated as they are. Risk-free yield has a definite allure at present – even for investors who are not looking for a safe haven.
Figure 1. The market is close to “extreme greed” mode
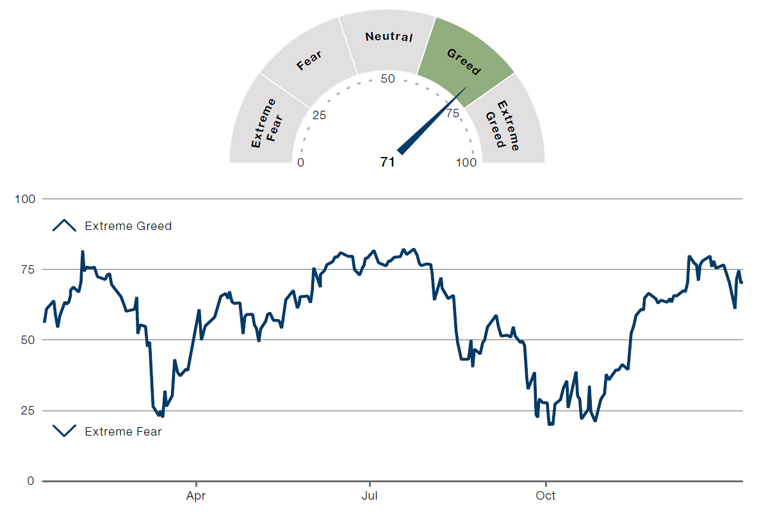
Source: CNN Business, as at 12 January 2024.
Before we delve into why this greed measure might be more of a warning than a sign of good things to come, let’s first consider why the market is seemingly so exuberant: for that, we need to look to the Federal Reserve (Fed). The Fed has been fighting pandemic-fueled inflation now for the better part of two years, and if the graph below tells us anything, the Fed, after initially missing the damage that was done to price stability, is doing an admirable job. It has managed to bring down inflation to low single digits from the June 2022 peak and has done so without hurting its other mandate of unemployment (figure 3) which has remained below 4% since February 2022. The market loves the fact that to date the Fed has seemingly been able to thread the needle of a soft landing – November 2023 was the largest cross-asset rally since before the Global Financial Crisis – but how soon the Fed can start easing monetary policy is a matter of great debate.
Figure 2. US Consumer Price Index - Inflation now at low single digits from its June 2022 peak
Problems loading this infographic? - Please click here
Source: US Bureau of Labor Statistics. Available here: www.bls.gov/charts/consumer-price-index/consumer-price-index-bycategory-line-chart.htm
Figure 3. US unemployment remains steady since February 2022
Problems loading this infographic? - Please click here
Source: US Bureau of Labor Statistics. Available here: www.bls.gov/charts/employment-situation/civilian-unemploymentrate.htm
From what we’ve seen in recent weeks, the market’s shift to risk-on has been especially painful for short sellers being squeezed as the market melts up. In December 2023, the most shorted stocks (as measured by the Goldman Sachs Most Shorted Rolling Index) rallied 21%. Compare that to the most held long positions by hedge funds (proxied by the Goldman Sachs Hedge Industry VIP ETF) which is only up 3%. This feels like a sign of capitulation as market participants give up the ghost of a hard landing. But has that call been made too soon? Rates markets don’t think so.
Figure 4. The junk rally
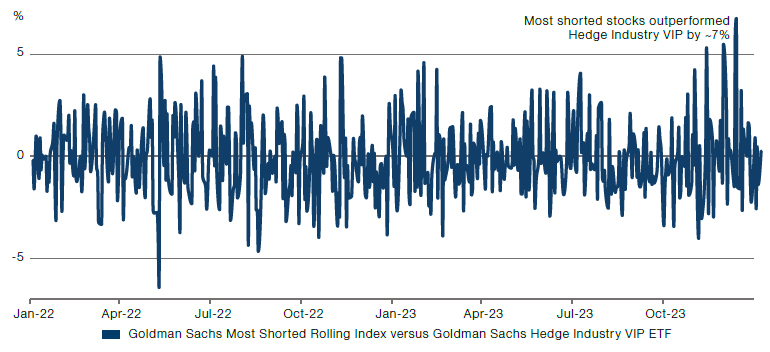
Source: Bloomberg, as at 31 December 2023.
We can gauge the market’s expectation on the path of the Fed funds rate by implying probabilities through futures pricing. Through this lens, we see that the market is implying almost a full 25bps cut to rates (actually, 22bps) with an estimated 75% probability of this happening at the March 2024 meeting, and a further 125bps(!) of cuts spread throughout the rest of 2024. That means that there are six 25bps cuts priced in for 2024 during eight meetings (January, March, May, June, July, September, November and December).
It seems unlikely that the Fed would take action during September and November unless absolutely necessary (i.e. recession), namely because it is unlikely to want to be seen as political and as having an impact on the US presidential election. This would mean that the Fed would need to make the majority of its cuts at the first six meetings. January seems unlikely for a cut – the Fed is still data-dependent and waiting for the effects of higher rates to slowly cool the economy. So that leaves only the March, May, June and July meetings to cut. The implied rate cuts through to the July meeting is nearly a full 100bps. That would mean 25bps cuts at each of those four meetings. This seems unlikely unless one of two things take place: 1) the US economy takes a sharp nosedive and/or unemployment rises dramatically; or 2) there is a large, idiosyncratic risk-off event.
Figure 5. Implied US interest rate and number of Fed cuts during 2024
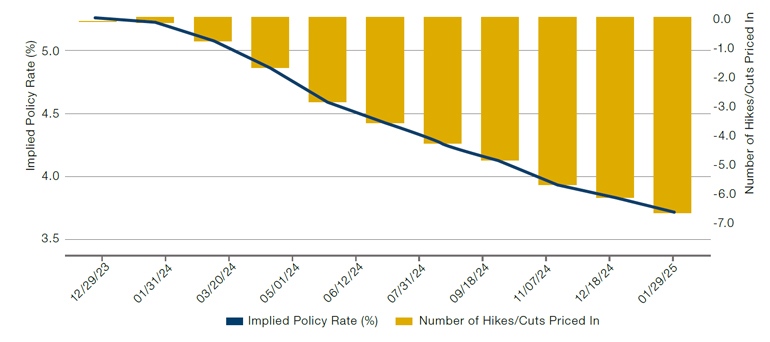
Source: Bloomberg, as at 29 December 2023.
The US economy proved to be quite resilient in 2023. Annual GDP growth for 3Q2023 rose at 4.9%, up from 2.1% in 2Q2023.2 So the likelihood of a sudden US economy nosedive seems low. As referenced earlier, unemployment has been steadily below 4% since the beginning of 2022, and the stimulus effect of the market rally has allowed for tighter financial conditions to continue, so the odds of a sudden hard landing feels remote.
That brings us to the second possibility: a large idiosyncratic risk-off event. The scary thing about such events is that we rarely see them coming. Unfortunately, however, there are enough hot spots geopolitically to make the risk-aware hairs on the backs of our necks stand up. The Russia-Ukraine conflict comes to mind first. When it began in February 2022, it exacerbated the existing inflationary forces in the market. Geopolitical turmoil in the Middle East can have an outsized impact on the global economy, and yet the market seems to be underpricing the impact of the Israel-Hamas war and conflicts in the Red Sea that are arising. In response to recent attacks on commercial ships in the Red Sea by Houthi rebels, we saw the US and UK carry out targeted strikes in Yemen on 11 January, raising fears about further escalation of conflict in the region. An estimated 30% of global trade traverses the Red Sea each day and is a crucial route for the world’s oil trade. The Red Sea has become even more important for Russian oil shipped to Asia as European countries have shunned Russian oil imports following the invasion of Ukraine. A potential blockage of the Red Sea, and more specifically the Suez Canal, would interrupt not just oil shipments, but also cause supply chain issues for key consumer goods like Chinese car parts and Indian cotton. These supply chain disruptions, even if only temporary, would likely cause an uptick in inflation giving support to the Fed to keep rates higher for longer, or even hike the target rate further.
Idiosyncratic risk-off events have a way of spreading into global markets, and in this case, there’s the potential for them to undo some of the work that the Fed (and other central banks) have done to fight inflation. If we were to see another wave of rising inflation, then it’s safe to say that we won’t see the Fed Funds rate 150bps lower in 2024.
Conclusion
This all puts the Fed on a knife’s edge. The market is giving it the proverbial thumbs-up on a job well done, and yet there feels like there is nearly balanced risk between the Fed being able to declare mission accomplished and start easing again, and the risk that inflation isn’t dead yet and could be exacerbated by forces outside of the Fed’s control which would mean it has to disappoint the market and return to tightening.
All in all, the potential upsides and downsides of the current market environment don’t provoke tremendous optimism. Given how “greedy” the market is currently looking, it may well be that the risks that loom in 2024 are underpriced.
With contributions from Jonathan Daffron, Head of Managed Account Platform, at Man FRM.
1. As at 12 January, 2024. For more on the inputs to this metric, see this page: Fear and Greed Index - Investor Sentiment | CNN.
2. Source: www.bea.gov/data/gdp/gross-domestic-product
Index definitions
Goldman Sachs Most Shorted Rolling Index
Goldman Sachs Most Shorted Rolling Index is an equal-weighted basket of the 50 highest short-interest names in the Russell 3000. Names in the basket have a market capitalisation greater than $1billion. This basket is updated on a monthly basis.
Goldman Sachs Hedge Industry VIP ETF
Goldman Sachs Hedge Industry VIP ETF seeks to track the performance of the Goldman Sachs Hedge Fund VIP Index. Goldman Sachs Hedge Industry VIP Index is designed to deliver exposure to equity securities whose performance is expected to influence the long portfolios of hedge funds.
You are now leaving Man Group’s website
You are leaving Man Group’s website and entering a third-party website that is not controlled, maintained, or monitored by Man Group. Man Group is not responsible for the content or availability of the third-party website. By leaving Man Group’s website, you will be subject to the third-party website’s terms, policies and/or notices, including those related to privacy and security, as applicable.