A Sector-by-Sector View on Employment Trends
The latest official data on US jobs suggest a softening labour market. Unemployment insurance claims reached their highest level since November 2021 ; the Federal Reserve’s April Beige Book reported moderating employment growth and highlighted that “a small number of firms reported mass layoffs, and those were centered at a subset of the largest companies”.
Cuts at the mega-cap tech firms have certainly garnered the most media attention, but how broad-based is the cooling? We can aggregate active job-listing data for a more granular story of job growth at publicly traded companies over the past several years.
At the start of the pandemic, we can see the Consumer Discretionary sector take the biggest hit, dropping from a high of one million active job postings to a trough of 710,000 in May 2020 (Figure 1, yellow line). A slower but equally emphatic decline is now evident in Information Technology (red line). The number of vacancies doubled in this sector from the start of 2020 to a peak in May 2022, but the downtrend since then seems firmly entrenched amid tightening rates and recessionary expectations.
Interestingly, the rally in tech stocks this year doesn’t seem to have affected the recruitment trajectory. Will such enthusiasm in the equity market be replicated with a lag in the labour market, or does the disappearance of job postings augur a hard landing?
Figure 1. Active Job Postings by GICS Sector
Problems loading this infographic? - Please click here
Source: Man Numeric and LinkUp; as of 31 March 2023.
The Baumol Effect and AI
Economist William Baumol posited that wage growth wasn’t just the result of productivity gains; pay can also rise in less-productive areas simply in response to salaries climbing elsewhere in the economy. His insight highlights that growth is determined not only by what we are good at, but also what is essential yet hard to improve.
Empirically, in Figure 2 we see a relationship consistent with the Baumol hypothesis – a negative correlation between sectors’ growth in output prices and their Total Factor Productivity. Tech hardware is an important driver of this phenomenon of greater productivity and falling prices: all the observations in the bottom-right quadrant of the chart fall within this sector.
Pharmaceuticals and medicine, rental services (such as for cars), and apparel have in contrast exhibited significant drops in productivity through this period while still enjoying growth in output prices. Tobacco, legal services, and oil-and-gas extraction have also had among the highest increases in prices.
This could be a potential roadblock to AI taking over the world: it may drive higher productivity, but it clearly does not follow that this will be rewarded by higher pricing power.
Figure 2. US Growth in Output Prices Versus Growth in Total Factor Productivity by Industry, 1987-2020
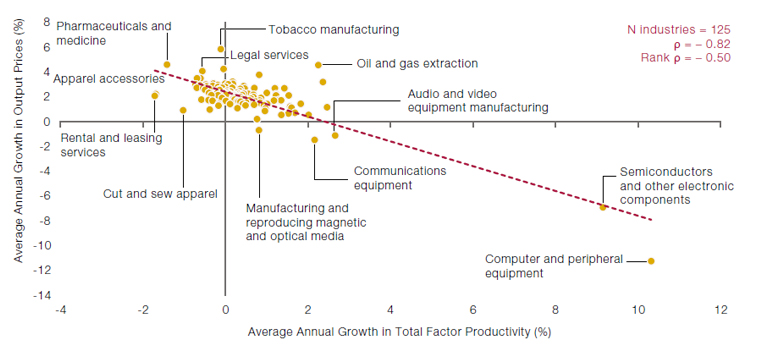
Source: Numeric calculations and Bureau of Labor Statistics, Office of Productivity and Technology. Major Industries,
1987-2021 (released 18 November 2022). Detailed industries in manufacturing, air transportation, and line-haul railroads,
1987-2020 (released 23 February 2023). https://www.bls.gov/productivity/tables/home.htm.
Picking Stocks Was Hard in the First Quarter
Pick any stock in the S&P 500 Index. During the first quarter of the year, it had the lowest probability of beating the index since the first quarter of 2000.
At 35% through 2023’s opening three months, this hit rate for outperforming the S&P 500 has sunk to one of its lowest points in the past few decades – to levels last seen during the build up to the global financial crisis and tech bubble (Figure 3).
This is a dramatic reversal from the fourth quarter of 2022 for the S&P 500, when we experienced a high 64% hit rate (versus the long-term average of 50%).
The MSCI World Index’s hit rate has also declined but remains higher, which in our view highlights the availability of opportunities internationally. Even though the hit rate seems meagre, it is still far from the previous lows that stock pickers have weathered.
Figure 3. Quarterly Index Hit Rates
Problems loading this infographic? - Please click here
Source: Man Numeric and Bloomberg; as of 31 March 2023.
With contribution from: George Slavov (Senior Engineer, Man Alpha Technology – Numeric); Greg Bond (CEO, Man Numeric); and Nina Gnedin (Portfolio Manager, Man Numeric)
You are now leaving Man Group’s website
You are leaving Man Group’s website and entering a third-party website that is not controlled, maintained, or monitored by Man Group. Man Group is not responsible for the content or availability of the third-party website. By leaving Man Group’s website, you will be subject to the third-party website’s terms, policies and/or notices, including those related to privacy and security, as applicable.