Man Institute > Why Aren't People Shorting Expensive Equities in an Earnings Recession?

ARTICLE | 5 MIN | VIEWS FROM THE FLOOR

Why Aren't People Shorting Expensive Equities in an Earnings Recession?

February 28, 2023

Investors aren’t taking the short bait; the pain trade of Value timing; and a breakdown in factor correlations.

Short Patience or Short of Courage: The Curious Lack of Bets Against Unattractive Equities

You can make a compelling case against owning equity beta in two straightforward charts. First, stocks look expensive relative to bonds: Figure 1 shows our ‘FED’ model, which subtracts the 10-year US Treasury yield from the S&P 500 Index’s forward earnings per share (‘EPS’). This spread is now at its lowest point over the 18 years for which we have complete forward earnings data. Second, the consensus view on US earnings is now negative across the board (Figure 2). This is considerably more pessimistic than even the first half of 2022, when analysts had to weigh the start of a land war in Europe and rapidly tightening monetary policy.

And yet, despite these significant headwinds for equity indices, we also note that short-interest utilisation in our global universe (Figure 3) has declined from October heights of 12.7% on an equal-weighted basis (and 5.2% when cap weighted) to 11.4% (and 4.4%).

Why aren’t traders taking the bait? We believe that even though being long the market is relatively unappealing, investors in aggregate are cautious of the potential for volatility and sharp rallies to punish shorts.

Figure 1. FED Model: Forward S&P 500 EPS Minus 10-Year US Treasury Yield

Problems loading this infographic? - Please click here

Source: Man Numeric; as of 17 February 2023.

Figure 2. Change in Consensus View on US Nominal Earnings Per Share

Problems loading this infographic? - Please click here

Source: Man Numeric; as of 16 February 2023.

Figure 3. Short Interest Utilisation in Global Equities

Problems loading this infographic? - Please click here

Source: Man Numeric; as of 17 February 2023.

Value Timing – The Pain Trade

The possibility of timing factor exposure is as enticing as it is contentious. Intuitively, a period of sustained underperformance should leave a factor primed for recovery. But experience teaches that it is unwise to rely on any mechanistic reversion. The tension is perhaps clearest with Value: when the factor becomes much cheaper than its historical range, an allocation becomes tempting.

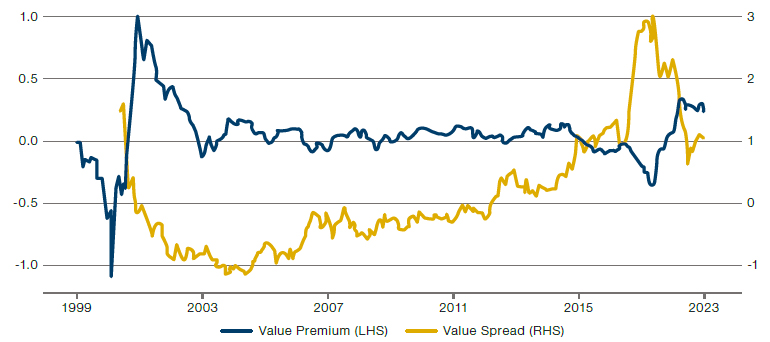
Our analysis suggests that such moments can be attractive entry points, but only for those with long investment horizons and high pain thresholds. Figure 4 plots Value, as measured by book-to-price (‘BP’) ratios, for the largest 1,000 US equities. The yellow line represents the Value spread, calculated as the winsorized ratio of the 75th BP percentile to the 25th percentile; the higher the reading, signifying people paying more for Growth than Value, the better the potential opportunity in Value. The blue line portrays the Value premium, calculated as the next-month return differential between an equal-weighted Value portfolio (the cheapest third of the universe) and an equal-weighted Growth portfolio (the most expensive third of the universe), rebalanced monthly. When it hits 1, for example, it means Value has outperformed the Growth portfolio by 100% over the previous 12-month period.

The most salient point here, in our view, is that extreme levels of Value spread can forecast Value outperforming over the next 12 months – albeit with material drawdowns along the way.

Figure 4. Value Opportunity Versus Value Premium

Source: Man Numeric; as of 16 February 2023.

More Twists on the Factor Rollercoaster

Factor reversals happen, but rarely so dramatically or so completely as over the past two months. The generic exposures that rewarded investors in 2022 have hurt them this year, and vice versa (Figure 5). Adding to the whiplash effect, we also see that the period from 17-22 February 2023 brought a miniature reversal of the reversal.

The magnitude of the turnaround in Volatility and generic Beta, in particular, through the start of 2023 has been exceptional by historical standards. Indeed, a generic factor model that equally weighted Value, Momentum, Anti-Volatility and Earnings Quality had one of its worst-ever months in January (Figure 6).

Such a left-tail outcome should not be discounted as purely anomalous, in our view. Looking ahead, we should be aware that the Momentum/Volatility/Value diversification complex – the bedrock of generic models given their negative correlation for much of the recent past – has broken down, for now at least (Figure 7). Anti-Volatility/ Momentum and Value/Momentum have reached a degree of positive synchronisation never before seen in our dataset. In our experience, these periods of elevated correlations can persist for 12-18 months.

Figure 5. Generic Factor Performance in Sector-Neutral Global Equities

Problems loading this infographic? - Please click here

Source: Man Numeric; as of 22 February 2023. 2023 performance is not annualised.

Figure 6. Monthly Returns of Generic Factor Model, January 2000 to February 2023

Problems loading this infographic? - Please click here

Source: Man Numeric; as of 22 February 2023.

Figure 7. One-Year Trailing Return Correlation in Global Equities

Problems loading this infographic? - Please click here

Source: Man Numeric; as of 22 February 2023.

With contributions from: Eric Wu (Man Numeric – Principal, Quantitative Alpha Integration and Strategy), Yakym Pirozhenko (Man Numeric – Quantitative Alpha Integration and Strategy Analyst), Wanjun Jin (Man Numeric – Senior Portfolio Manager), and Andrew Kindman (Man Numeric – Portfolio Manager)

For further clarification on the terms which appear here, please visit our Glossary page.

This information is communicated and/or distributed by the relevant Man entity identified below (collectively the "Company") subject to the following conditions and restriction in their respective jurisdictions.

Opinions expressed are those of the author and may not be shared by all personnel of Man Group plc (‘Man’). These opinions are subject to change without notice, are for information purposes only and do not constitute an offer or invitation to make an investment in any financial instrument or in any product to which the Company and/or its affiliates provides investment advisory or any other financial services. Any organisations, financial instrument or products described in this material are mentioned for reference purposes only which should not be considered a recommendation for their purchase or sale. Neither the Company nor the authors shall be liable to any person for any action taken on the basis of the information provided. Some statements contained in this material concerning goals, strategies, outlook or other non-historical matters may be forward-looking statements and are based on current indicators and expectations. These forward-looking statements speak only as of the date on which they are made, and the Company undertakes no obligation to update or revise any forward-looking statements. These forward-looking statements are subject to risks and uncertainties that may cause actual results to differ materially from those contained in the statements. The Company and/or its affiliates may or may not have a position in any financial instrument mentioned and may or may not be actively trading in any such securities. Unless stated otherwise all information is provided by the Company. Past performance is not indicative of future results.

Unless stated otherwise this information is communicated by the relevant entity listed below.

Australia: To the extent this material is distributed in Australia it is communicated by Man Investments Australia Limited ABN 47 002 747 480 AFSL 240581, which is regulated by the Australian Securities & Investments Commission ('ASIC'). This information has been prepared without taking into account anyone’s objectives, financial situation or needs.

Austria/Germany/Liechtenstein: To the extent this material is distributed in Austria, Germany and/or Liechtenstein it is communicated by Man (Europe) AG, which is authorised and regulated by the Liechtenstein Financial Market Authority (FMA). Man (Europe) AG is registered in the Principality of Liechtenstein no. FL-0002.420.371-2. Man (Europe) AG is an associated participant in the investor compensation scheme, which is operated by the Deposit Guarantee and Investor Compensation Foundation PCC (FL-0002.039.614-1) and corresponds with EU law. Further information is available on the Foundation's website under www.eas-liechtenstein.li.

European Economic Area: Unless indicated otherwise this material is communicated in the European Economic Area by Man Asset Management (Ireland) Limited (‘MAMIL’) which is registered in Ireland under company number 250493 and has its registered office at 70 Sir John Rogerson's Quay, Grand Canal Dock, Dublin 2, Ireland. MAMIL is authorised and regulated by the Central Bank of Ireland under number C22513.

Hong Kong SAR: To the extent this material is distributed in Hong Kong SAR, this material is communicated by Man Investments (Hong Kong) Limited and has not been reviewed by the Securities and Futures Commission in Hong Kong.

Japan: To the extent this material is distributed in Japan it is communicated by Man Group Japan Limited, Financial Instruments Business Operator, Director of Kanto Local Finance Bureau (Financial instruments firms) No. 624 for the purpose of providing information on investment strategies, investment services, etc. provided by Man Group, and is not a disclosure document based on laws and regulations. This material can only be communicated only to professional investors (i.e. specific investors or institutional investors as defined under Financial Instruments Exchange Law) who may have sufficient knowledge and experience of related risks.

Switzerland: To the extent this material is made available in Switzerland the communicating entity is:

  • For Clients (as such term is defined in the Swiss Financial Services Act): Man Investments (CH) AG, Huobstrasse 3, 8808 Pfäffikon SZ, Switzerland. Man Investment (CH) AG is regulated by the Swiss Financial Market Supervisory Authority (‘FINMA’); and
  • For Financial Service Providers (as defined in Art. 3 d. of FINSA, which are not Clients): Man Investments AG, Huobstrasse 3, 8808 Pfäffikon SZ, Switzerland, which is regulated by FINMA.

United Kingdom: Unless indicated otherwise this material is communicated in the United Kingdom by Man Solutions Limited ('MSL') which is a private limited company registered in England and Wales under number 3385362. MSL is authorised and regulated by the UK Financial Conduct Authority (the 'FCA') under number 185637 and has its registered office at Riverbank House, 2 Swan Lane, London, EC4R 3AD, United Kingdom.

United States: To the extent this material is distributed in the United States, it is communicated and distributed by Man Investments, Inc. (‘Man Investments’). Man Investments is registered as a broker-dealer with the SEC and is a member of the Financial Industry Regulatory Authority (‘FINRA’). Man Investments is also a member of the Securities Investor Protection Corporation (‘SIPC’). Man Investments is a wholly owned subsidiary of Man Group plc. The registration and memberships described above in no way imply a certain level of skill or expertise or that the SEC, FINRA or the SIPC have endorsed Man Investments. Man Investments Inc, 1345 Avenue of the Americas, 21st Floor, New York, NY 10105.

This material is proprietary information and may not be reproduced or otherwise disseminated in whole or in part without prior written consent. Any data services and information available from public sources used in the creation of this material are believed to be reliable. However accuracy is not warranted or guaranteed. © Man 2025