Workers of the World…Where Are You?
January’s huge US non-farm payroll number of 517,000, which smashed the consensus forecast of 185,000 but barely dented the unemployment rate of 3.4%1, seemed to validate one market narrative. The story was that the gradual normalisation of the labour-force participation rate after the pandemic would bring more workers back into the economy, and so help to alleviate wage pressures.
This may unfortunately be wishful thinking. When we break the participation rate into age cohorts, two themes become apparent (Figure 1). The first is the increase in the 16-24 group. This reflects the choice of many younger people to defer further education and enter the workforce instead, as would be expected given the incentives created by wage growth.
However, those joining the labour market are massively outweighed by those leaving it in the 65-plus category. Some analyses of this sort make 55+ the oldest cohort, which may induce hope that its members could return to work at some stage. Isolating the younger 55-64 component, though, makes clear that those more likely to seek employment again are a small minority of the total, as we expect those aged 65 or older to have a greater probability of having retired permanently.
We therefore would not count on labour-market latency to help ease inflationary pressures. That said, in the next section we do highlight some more encouraging trends.
Figure 1. US Labour Force Participation Rate
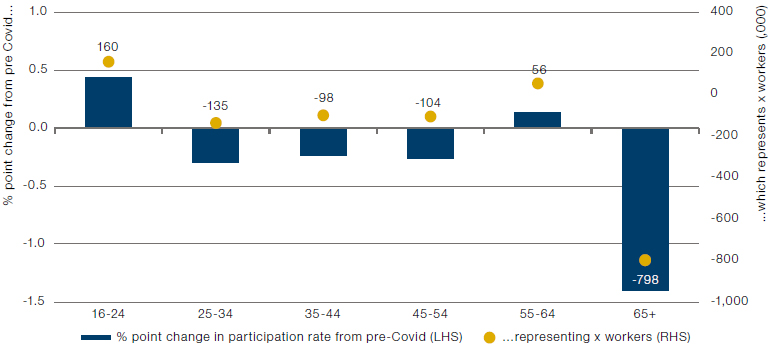
Source: Man DNA; as of 14 February 2023.
We Have Nothing to Lose But Wage Momentum
If you were waiting for your bonus before quitting to earn a higher salary elsewhere, we have bad news for you. If you were hoping to see signs that the US economy would avoid a wage/price spiral, we have better news.
The Federal Reserve Bank of Atlanta dissects wage growth in various ways. One compares those who stay in their job and those who change employer (Figure 2). As seems intuitive, those who switch jobs earn greater salary bumps than those who remain put. The gap between them grew even larger than usual as the wage spiral inflated, but is now rolling over; this indicates a reduction in workers’ bargaining power. Turning to wages by sector, we also see growth in services starting to roll over (Figure 3); this matters because pay in services tends to be more painful for the overall inflation rate given that these economic segments are more labour intensive. Finally, the various surveys run by regional Feds suggest employers’ planned compensation increases are slowing down.
Taken together, we find reasons to expect inflation to moderate even without significant supply being added to the labour force.
Figure 2. Atlanta Fed Wage Growth – Job Switchers Versus Job Stayers
Problems loading this infographic? - Please click here
Source: Bloomberg, Current Population Survey, Bureau of Labor Statistics, and Federal Reserve Bank of Atlanta Calculations; as of 1 January 2023. The data are 12-month moving averages of monthly median wage growth for each category. Wage computed on an hourly basis.
Figure 3. Atlanta Fed Wage Growth – Manufacturing Versus Services
Problems loading this infographic? - Please click here
Source: Bloomberg, Current Population Survey, Bureau of Labor Statistics, and Federal Reserve Bank of Atlanta Calculations; as of 1 January 2023. The data are 12-month moving averages of monthly median wage growth for each category. Wage computed on an hourly basis.
Are Green Bonds Fading?
2022 was a difficult year for many asset classes, but must have been a particular shock for those interested in green bonds. Having seen the issuance of green, social, sustainability, sustainability-linked and transition bonds (‘GSS+’) grow year on year for a full decade, GSS+ volumes slumped for the first time since records in this area began, falling from more than $1 trillion in 2021 to $863.4 billion last year.2
Much of this decline can of course be attributed to the general dearth of primary activity in debt markets in 2022, amid tightening financial conditions and the associated volatility, which also weighed on green bonds and the whole GSS+ universe too (Figure 1). But we believe there were exacerbating factors for green and other ESG-related bonds. First, they have faced accusations of greenwashing; several studies have found that only certified green bonds are associated with improved environmental performance by their issuer,3 but the Climate Bonds Initiative has reported that only around 20% of the global green-bond market is certified against the Climate Bonds Standard.4 Second, there is rising political risk as several jurisdictions in the US have restricted the use of GSS considerations by asset managers.5
It may nevertheless be premature to write an epitaph for green bonds. From the re-opening of China’s economy, which issued the most green bonds globally in 2022,6 to the Inflation Reduction Act in the US, we recognise that a strong case is being made on the importance of investing in the energy transition and environmental infrastructure. We expect much of this to be debt financed. Other developments, like greater scrutiny of Sustainable Finance Disclosure Regulation (SFDR) may lend further support to green bonds as such securities may be attractive for meeting the strictest demands of Article 9 qualification.
Finally, investors looking for an alternative within the GSS+ landscape should keep a few things in mind. While green bonds declined proportionately to the rest of the GSS+ space as a percentage of overall ESG issuance, sustainability-linked bonds gained at their expense given their broader key-performance-indicator targets (Figure 2). However, with loopholes emerging in the space – such as calling the bonds before the testing dates of their key performance indicators – we and other managers are discounting these trends. As more colour is given to green and related bonds going forwards, we believe investors need to monitor them carefully.
Figure 4. Performance of GSS+ Bond Indices
Problems loading this infographic? - Please click here
Source: Bloomberg; as of 14 February 2023.
Figure 5. GSS+ Issuance in 2022
Problems loading this infographic? - Please click here
Source: The Climate Bonds Initiative; as of 30 January 2023.
With contributions from: Henry Neville (Man Solutions – Portfolio Manager); and Christopher Oyin-Adeniji (Man Group – Responsible Investment Analyst)
1. Source: US Bureau of Labor Statistics; as of 3 February 2023.
2. Source: The Climate Bonds Initiative; 30 January 2023.
3. For example, Caroline Flammer, “Green Bonds: Effectiveness and Implications for Public Policy”, Environmental and Energy Policy and the Economy (2020) or Kim Ee Yeow & Sin-Huei Ng, “The Impact of Green Bonds on Corporate Environmental and Financial Performance”, Managerial Finance (2021).
4.Source: The Climate Bonds Initiative; April 2022.
5. Source: Bloomberg; 6 February 2023.
6. Source: The Climate Bonds Initiative; as of 31 December 2022.
You are now leaving Man Group’s website
You are leaving Man Group’s website and entering a third-party website that is not controlled, maintained, or monitored by Man Group. Man Group is not responsible for the content or availability of the third-party website. By leaving Man Group’s website, you will be subject to the third-party website’s terms, policies and/or notices, including those related to privacy and security, as applicable.