Black Friday, the day after the Thanksgiving holiday, marks one of the most important days of the year for US retailers and brands. This year, the day was a dud for many bricks and mortar stores, with the time when consumers would fight over discounted LCD televisions seemingly consigned to the past. Online retailers fared much better, however, and online Black Friday retail sales are projected to climb to $10 billion by 2024.1
Against this backdrop, we were interested to understand firstly whether some US firms have a ‘secret sauce’ that is driving such growth and secondly, if and how consumer spending patterns in the UK and US differ. To examine this, we used alternative data, specifically credit card spending data on publicly traded US companies.
Figures 1 and 2 compare year-on-year seasonally adjusted growth based on US and UK consumer credit card spending data for approximately 110 US listed retailers, which have both a US and UK presence. As one might expect, during the Covid-19 pandemic, the performance of retailers in the top and bottom quantiles significantly diverged as online players gained a lot of steam while bricks and mortar stores made large losses predominantly owing to lockdowns. Looking at the more recent period, we not only see that seasonally adjusted growth has slowed down, but that dispersion has materially compressed and is converging towards zero. This could indicate that, despite the headline Black Friday numbers, even high-flying e-commerce firms are experiencing a slowdown.
Figure 1. Year-on-year seasonally adjusted relative sales growth based on credit card spending data - US consumer panel
Problems loading this infographic? - Please click here
Source: Man Numeric, Consumer Edge. Data as at November 2023.
Figure 2. Year-on-year seasonally adjusted relative sales growth based on credit card spending data - UK consumer panel
Problems loading this infographic? - Please click here
Source: Man Numeric, Consumer Edge. Data as at November 2023.
Digging further into the detail, Figure 3 plots the performance of each of the 110 firms, with the x-axis representing US performance and the y-axis showing performance in the UK. Although there is a slightly positive correlation, there is some variation depending on the industry. While online marketplace Wish is losing market share all over the world owing to concerns about product safety, SharkNinja, which sells home appliances, is an example of a firm which is having more success in the UK than in the US. Arguably, such dispersion represents an opportunity for bottom-up investors who have a deep understanding of the dynamics of the retail market and the areas most likely to generate growth going forward.
Figure 3. Year-on-year seasonally adjusted relative sales growth based on credit card spending data for US versus UK consumer panel
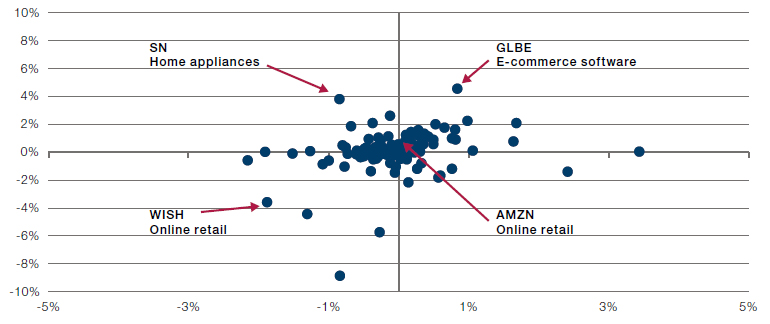
Source: Man Numeric, Consumer Edge. Based on period from November 2022 to November 2023.
Americans have been digging deeper
Turning to our second question on if and how consumer spending patterns in the UK and US differ, Figure 4 compares personal savings as a percentage of disposable income in both nations. It shows that while both UK and US consumers have elected to dig into their wallets in the face of high inflation, Americans have been digging deeper and spending more.
Figure 4. Personal savings in the US and UK as a percentage of disposable income (seasonally adjusted)
Problems loading this infographic? - Please click here
Source: US Bureau of Economic Analysis, UK Office of National Statistics.
Perhaps most striking is the level of equilibrium reached in both nations in recent quarters, which suggests that both UK and US consumers are uncomfortable drawing down on more of their savings. It is also notable that personal savings rates in the US are currently lower than they were before the pandemic while in the UK, they are slightly above pre-pandemic levels.
Conclusion
US and UK consumers appear to be settling into consistent rates of saving where they are not willing to dig deeper in the face of higher prices. At the same time, there is less dispersion and room for growth among retail companies, with only a few select outliers. Investors will now be keenly watching whether these declining spending trends are indicating there will be a successful economic soft landing ahead or if what follows next is a recession. Deep research and analysis of spending data will be key to keeping abreast of the evolution of the economic regime.
With contributions from Eric Wu, Principal, Quantitative Alpha Integration and Strategy, and Yudi Lu, Quantitative Researcher, at Man Numeric.
1. Source: Adobe Analytics.
You are now leaving Man Group’s website
You are leaving Man Group’s website and entering a third-party website that is not controlled, maintained, or monitored by Man Group. Man Group is not responsible for the content or availability of the third-party website. By leaving Man Group’s website, you will be subject to the third-party website’s terms, policies and/or notices, including those related to privacy and security, as applicable.