A Hard Landing: Recessions and High Yield Spreads
Last month we examined how rising wholesale inventory levels potential herald future recessions given that this indicator inversely leads the ISM Manufacturing PMI by around six months. Hard landings are invariably nasty for high yield spreads. So far, spread expansion has been modest. What might we expect if the next six months leads to a hard landing?
The long history of US high yield spreads shows that the biggest spread expansion has always happened around NBER recessions (Figure 1).
At the end of August, high yield spreads were about 500 bps. History suggests that in hard landing scenarios spreads do not stay at this level for long, rising by an average of 460 bps and to an average peak of 1140 bps during six month periods where the ISM Manufacturing index (our go-to high frequency indicator for recession) drops below 45. In addition, it worth also raising the question of the Fed’s balance sheet. As the Fed enacts quantitative tightening, it may further exacerbate the upward direction of credit spreads: in the two episodes of tightening in the US over the past 12 years, credit spreads have risen.
Figure 1. NBER Recessions and High Yield Spreads
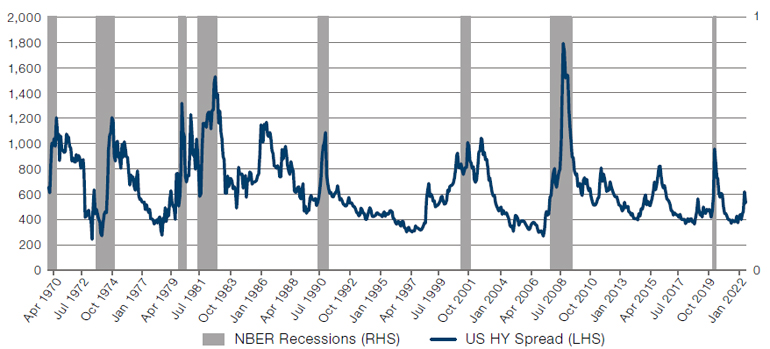
Source: Man GLG; as of 31 August 2022. The periods selected are exceptional and the results do not reflect typical performance. The start and end dates of such events are subjective and different sources may suggest different date ranges, leading to different performance figures.
US Earnings May Need to Come Down
As if to confirm that 2022 may be a year of trouble, earnings accruals have been increasingly poor across the US universe (Figure 2 - inverted). Accruals occur when a service is provided and revenue earned, but the cash component of the transaction (ie. actually getting paid) has not occurred. Accruals work both ways, with revenues and expenses accrued by firms over the course of the financial year.
The significance of deteriorating accruals is that it affects the working capital available to a firm – and over the long run its performance. If services are provided but not paid for, accruals rise, working capital increases and cash is depleted, preventing it from being put to productive use elsewhere.
It is normal for accruals to rise in times of economic stress, as some businesses find the harsher economic environment more challenging, and are less able to pay their suppliers. In our view however, such a sharp deterioration implies that hard times are already upon us – and analysts should revise their earnings forecast accordingly. If accruals deteriorate, earnings cannot be far behind.
Figure 2. US Accruals Ratio – Russell 1000 ex-Financials Working Capital Change Over Time (Inverted)
Problems loading this infographic? - Please click here
Source: Man Numeric, Bloomberg; as of 31 August 2022.
The One Place ESG is Outperforming - Flows
The story of the last decade has been green: responsible investment has gone from niche to mainstream. Nowhere has this been demonstrated more clearly than in fund flows, where ESG flows have gone from practically nothing to USD902 billion in less than ten years (Figure 3).
2022 has been tough in many respects and ESG has not escaped. Overall allocations to ESG have stagnated this year after their meteoric rise. It could be worse. Flows have turned sharply negative for non-ESG managers (Figure 4). Passive dominates active in non-ESG strategies, however ESG remains an active game (Figure 5). However, as volatility has risen over the year, there has been a clear shift towards passive ESG. Flows remain strongly positive for passive non-ESG funds, despite ESG passive vehicles lagging. However this has not translated into improved performance: while in 2021 all MSCI ESG indices outperformed their non-ESG counterparts, in 2022 underperformance has been ubiquitous (Figure 6).
The net result is stasis. While not losing assets as quickly as other managers, it is fair to say that the ESG revolution is on hold – for now.
Figure 3. Flows – ESG Versus Non-ESG
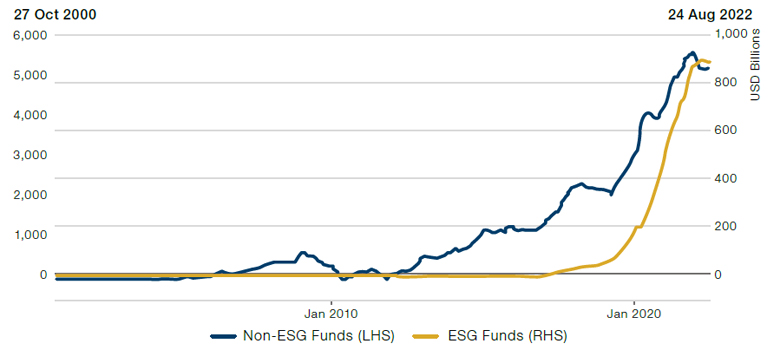
Source: Goldman Sachs; as of 24 August 2022.
Figure 4. Active Fund Flows – ESG Versus Non-ESG
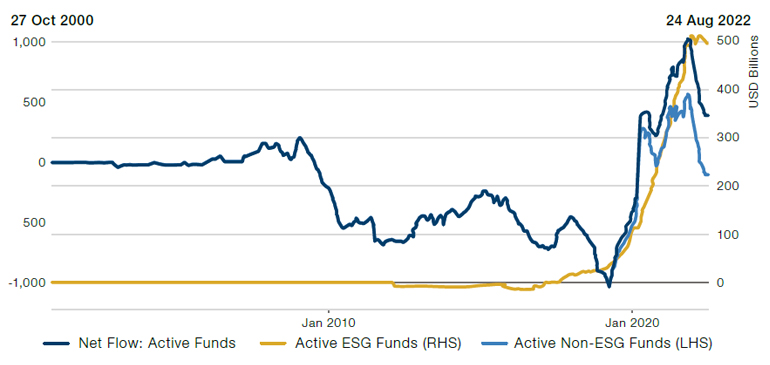
Source: Goldman Sachs; as of 24 August 2022.
Figure 5. Passive Versus Active ESG Fund Flows
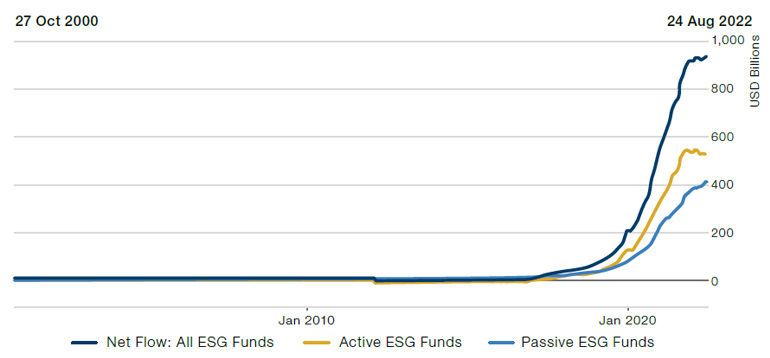
Source: Goldman Sachs; as of 24 August 2022.
Figure 6. ESG Versus Non-ESG Indices
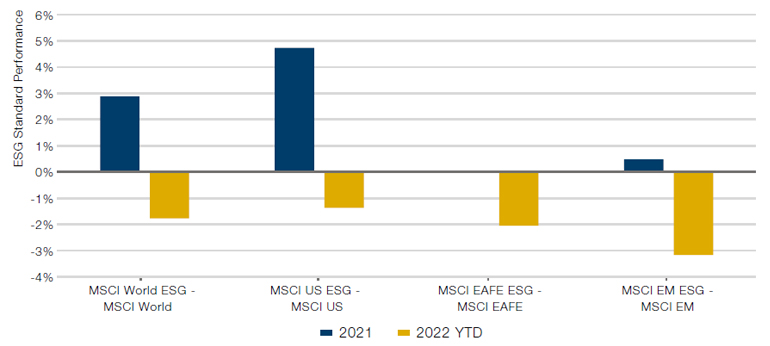
Source: Bloomberg; as of 31 August 2022.
With contributions from: Ed Cole (Man GLG – MD of Discretionary Investments), Dan Taylor (Man Numeric – CIO), Yakym Pirozhenko (Man Numeric - Quantitative Alpha Integration and Strategy Analyst), Rob Furdak (Man Group – CIO for Responsible Investment) and Jessica Henry (Man Group – ESG Analyst).
You are now leaving Man Group’s website
You are leaving Man Group’s website and entering a third-party website that is not controlled, maintained, or monitored by Man Group. Man Group is not responsible for the content or availability of the third-party website. By leaving Man Group’s website, you will be subject to the third-party website’s terms, policies and/or notices, including those related to privacy and security, as applicable.