The Great British Bond Sale
Volatility often creates market dislocations, but they are rarely as stark as we have seen in UK credit through recent weeks. Figure 1 illustrates one such anomaly, depicting the performance of a FTSE 100 consumer group’s shares and bonds. While domiciled in the UK, it is an international business that earns in US dollars; unsurprisingly, its equity has fared well this year. Its debt, on the other hand, has not. It is thus possible to secure an 8.9% yield to worst on its 30-year bonds, compared with its current dividend yield of 6.4%.
This is not an isolated example. In Figure 2, we see the performance of a mid-cap UK financial firm’s stock and debt. The share price has oscillated a little, but has generally held up as equity investors expect it to benefit from higher interest rates. Its bond – which is relatively short duration with a 2028 maturity – has in contrast dropped by 30% in almost a straight line. It now yields over 9% despite being investment grade.
Divergences between equities and bonds of this magnitude are highly unusual. We attribute it to the greater efficiency of the stock market, while the credit space has been slower to react and perhaps weighed down by technical liquidity concerns. The moves nevertheless offer bondholders the widest margin of safety they have seen in this area since the financial crisis, with the exception of a few days at the height of the Covid panic in March 2020. We view this as a once-in-a-cycle opportunity, especially for those who believe inflation is decelerating and wish to lock in nominal yields of around 9% for the long term.
Figure 1. Equity Versus Bond Total Return at a Large-Cap UK Consumer Group
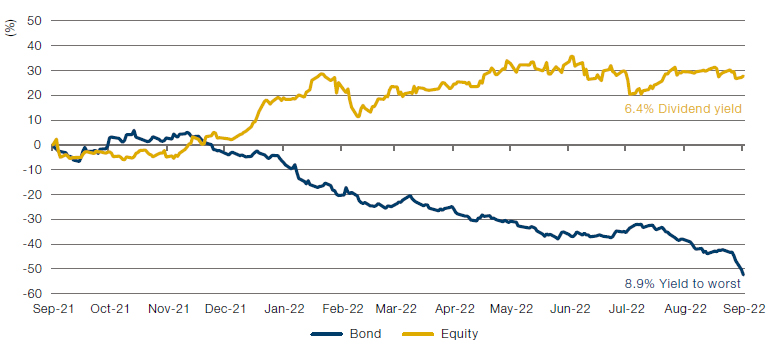
Source: Bloomberg; as of 27 September 2022. The organisations and/or financial instruments mentioned are for illustrative purposes only. The content of this material should not be construed as a recommendation.
Figure 2. Equity Versus Bond Total Return at a Mid-Cap UK Financial Group
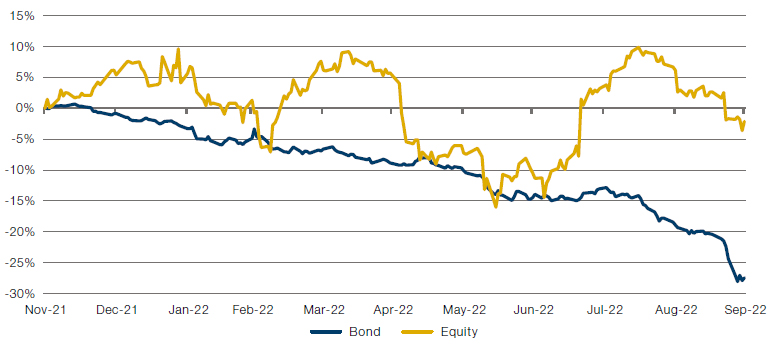
Source: Bloomberg; as of 29 September 2022. The organisations and/or financial instruments mentioned are for illustrative purposes only. The content of this material should not be construed as a recommendation.
A New Special Purpose for SPACs
You could be forgiven for having forgotten about Special Purpose Acquisition Companies (SPACs). Since their zenith during the boom in meme stocks early last year, these shell corporations – intended to help take private businesses public – have appropriately enough become shells of their former selves. As well as withering in performance terms (Figure 3), issuance has collapsed too – from 613 launched in 2021 to 115 in 2022 as at the end of September.1
Yet look closely, and you may well find SPACs among some hedge funds’ holdings. Indeed, a few managers even have more exposure to SPACs today than they did in February 2021 (Figure 4). They aren’t so much fashionably late to the party as gate-crashing the venue as it’s being cleaned up afterwards.
We don’t think this is the whole story, though. SPACs aren’t just acquisition vehicles; they are also exchange-traded pools of cash (typically invested in short-dated US Treasuries). With their prospects for striking deals having dimmed, many now trade at market capitalisations below their net asset values. If they don’t sign deals within a given timeframe, they are liquidated and the cash is returned to shareholders. In other words, investors can buy a claim on USD 10 for USD 9.
This seems to us what is happening now. The managers we have identified as holding SPACs are tending to buy at a discount rather than paying a premium (Figure 5). We believe managers are viewing SPACs more as fixed income or positive carry instruments taking the US Treasury yields, not speculative equities, and are expecting to redeem at net asset value (with potential equity upside if an acquisition target is identified).
Figure 3. Performance of the SPAC Market Since its Peak
Problems loading this infographic? - Please click here
Source: Bloomberg; as of 28 September 2022. Rebased to 100 at market peak on 17 February 2021.
Figure 4. SPAC Exposure Looks Higher…
Problems loading this infographic? - Please click here
Source: Man FRM and Bloomberg; as of 28 September 2022. The six managers shown on Figures 4 and 5 are those on Man FRM’s hedge-fund platform that had exposure to SPACs on the specified dates.
Figure 5. …But Risk is Actually Lower
Problems loading this infographic? - Please click here
Source: Man FRM and Bloomberg; as of 28 September 2022.
Are Fund Managers Holding Their Breath?
In our monitoring of the hedge-fund market, we often take note of the levels of turnover in different portfolios. Using holdings data, we can compare turnover from month to month and identify trends as managers purchase or sell single-name holdings or – as seen in the recent market uncertainty – simply hold their holdings.
In Figure 6, the portfolio turnover levels of three anonymised Equity Long/Short managers are shown alongside the wider average. The degree of turnover is relative to the average of the past two years: a reading of 100%, for example, would show a manager purchasing and selling as many names as would normally be expected. Since June 2022, the average manager – including those highlighted here – has entered a holding pattern, with one turning over their portfolio less than half as much as they might previously have done.
The summer’s volatility and market uncertainty have clearly weighed on fund managers as they assess potential trades, with Equity Long/Short managers on Man FRM’s platform in particular turning over their portfolio more slowly than they have on average since inception. As the Federal Reserve shows no sign of slowing its rate hikes, we might expect those fund managers putting off portfolio decisions for calmer times to have to make up their minds sooner than later.
Figure 6. Portfolio Turnover Relative to Two-Year Average
Problems loading this infographic? - Please click here
Source: Man FRM; as of 31 August 2022. The three managers shown are a representative sample of Equity Long/Short funds on Man FRM’s platform. The average shown is of these three managers.
With contributions from Jonathan Golan (Man GLG – Portfolio Manager) and Jonathan Daffron (Man FRM – Deputy Head of Investment Risk)
1. Source: SPACInsider; as of 28 September 2022.
You are now leaving Man Group’s website
You are leaving Man Group’s website and entering a third-party website that is not controlled, maintained, or monitored by Man Group. Man Group is not responsible for the content or availability of the third-party website. By leaving Man Group’s website, you will be subject to the third-party website’s terms, policies and/or notices, including those related to privacy and security, as applicable.