The US Data That Drives the Dollar
Volatility is back – not least in the world of FX. Sterling, the euro, and the yen are down by more than 18%, 14% and 26% respectively against the US dollar year to date, and all by more than 2.5% since the beginning of September (Figure 1). A great deal (although not all) of these moves has been caused by the continuing strength of the US dollar, itself driven by rate hikes of 75bps by the Federal Reserve on 21 September.
As Londoners survey the chaos caused by a buoyant greenback, it is worth considering why the Fed remains committed to its course. Quite simply, US employment data don’t look like faltering any time soon and regional employment sub-indices of Fed surveys are still in expansion territory (Figure 2).
Furthermore, US unemployment is yet to rise above recession-predicting levels. The Sahm indicator predicts that a recession will occur if the three-month moving average of U3 unemployment rises by 50bps or more above its previous 12-month low. As we can see from Figure 3, we still have a considerable way to go, with the three-month moving average only 3bps higher than the previous 12-month low.
Figure 1. USD versus GBP, EUR and JPY
Problems loading this infographic? - Please click here
Source: Bloomberg; as of 29 September 2022.
Figure 2. Regional Fed Employment Sub-Indices
Problems loading this infographic? - Please click here
Source: Federal Reserve; as of 30 August 2022.
Figure 3. The Sahm Indicator
Problems loading this infographic? - Please click here
Source: Claudia Sahm, Federal Reserve Bank of St Louis; as of 31 August 2022.
The periods selected are exceptional and the results do not reflect typical performance. The start and end dates of such events are subjective and different sources may suggest different date ranges, leading to different figures.
Credit Risk in the Eye of the Storm
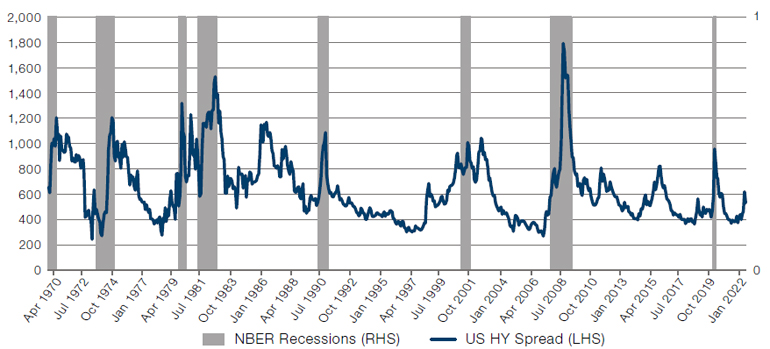
A relatively little-discussed aspect of the credit markets is that, despite a year of historic carnage in fixed income (the iBoxx US Dollar Investment Grade Corporate Bond Index is down more than 20% in the calendar year to 27 September), credit spreads had remained relatively complacent. That changed in September. The benchmark CDX Investment Grade Index, which was as low as 74bps in August, spiked to over 110 (Figure 4). The CDX High Yield Index added over 200bps during the same period to reach 625bps. Investors finally appear to be accepting that corporate borrower default frequency is likely to rise in the coming year.
For underwriters of credit risk, the selloff is greatly welcome. Through the first half of the year, we saw little indication that investors were taking credit risk seriously. The three-month moving average of high-yield credit spreads exceeded 500bps only at the end of July. Such complacency belied evident signs that inflation had broken well above target rates and that the monetary response to force inflation back toward long-term targets was likely to lead to substantial economic contraction. At such times, expected returns to underwriting credit risk decline materially.
Over the past few weeks, however, investors have finally begun to demand more from corporate borrowers. In fact, the 200bps rise in the CDX High Yield index implies investors expect to see the high-yield default rate rise from 39% to 52% over the coming five years1. This newfound conservatism among credit investors has led issuers of credit risk sharing transactions to reduce the amount of high-yield exposure they sell and to increase the amount of spread, or premium, they pay. We are now regularly seeing transactions that are 90% or more investment grade paying premia of 10% or greater on top of risk-free overnight reference rates (in US dollars at least) of 3%. Deriving credit risk and future short-term floating rates from current swap markets, we expect prospective internal rates of return, net of credit loss, for credit risk sharing should be in the order of 11%, which would make this the most lucrative underwriting environment we have seen in a decade2.
Figure 4. CDX IG and HY Indices
Problems loading this infographic? - Please click here
Source: Bloomberg; as of 29 September 2022.
Exceeding Low Expectations
The S&P 500 Index has had a rough year, with analysts adjusting their expectations accordingly (Figure 5). With Q2 EPS growth estimates at 5% year-on-year, realised growth was 7.1%.
As a consequence, according to MS Equity Strategy, full-year EPS growth expectations are down to 8% from 10%, and 2023 estimates are down to 7% from 8%.
What is intriguing are the sector splits. The sector with the most disappointing YoY EPS growth has been communications: -38% versus -13% expected. The best outperforming sector YoY has been materials: +17% versus -2% expected.
On an absolute basis, though, there are no surprises. By far the most impressive sector has been energy, which had earnings growth of more than 300%. In fact, without energy stocks in the S&P 500, the overall earnings growth would have been negative, not positive as stated above.
Figure 5. SPX EPS Consensus Estimates
Source: MS Equity Strategy, Factset; as of 28 September 2022.
With contributions from: Ed Cole (Man GLG – MD of Discretionary Investments), Matthew Moniot (Man GPM – Managing Director, Co-Head of Credit Risk) and Jonathan Daffron (Man FRM – Deputy Head of Investment Risk)
1. Source: Man GPM calculations; as of 29 September 2022.
2. Source: Man GPM calculations; as of 29 September 2022.
You are now leaving Man Group’s website
You are leaving Man Group’s website and entering a third-party website that is not controlled, maintained, or monitored by Man Group. Man Group is not responsible for the content or availability of the third-party website. By leaving Man Group’s website, you will be subject to the third-party website’s terms, policies and/or notices, including those related to privacy and security, as applicable.