Are US Companies Short on Cash?
We’ve previously noted the problem rising accrual levels pose for expected US earnings. Since September, however, the problem has only gone from bad to worse, with accruals now at their highest level in over 20 years1.
Accruals can occur when a service is provided and revenue earned but cash has not been received, or when inventory is built but not yet sold. In fundamental terms, the more the accruals, the higher a company’s working capital and the lower the company’s cash flow relative to net income. This in turn presents a potential problem – if accruals rise across the market, customers may be having a hard time paying bills and/or inventories could be broadly rising.
The sharp rise in accruals therefore indicates that American companies may currently be “overearning”. As such, we would expect further negative earnings revisions in the future, and depending on market expectations, falling stock prices in response.
Figure 1. US Accruals Ratio – Raw Inverse Working Capital Change in Russell 1000 Index
Problems loading this infographic? - Please click here
Source: Man Numeric; as of 15 November 2022.
A Most Cheerful Chart
The OECD’s Composite Leading Indicator (‘CLI’) has fallen to almost -3% yoy as of the end of October, the fourth worst reading since the series began in 1962. The CLI signals early changes in businesses, with components focusing on industrial indicators, inventories, employment metrics and measures of confidence2.
Since the initiation of the time series, the US has remained the world’s largest economy by some margin. As such, the US is the biggest contributor to the CLI metric3.
The current reading thus bodes very poorly for hopes of a soft landing in 2023: whenever a CLI readings has been this negative before, it has historically been followed by a US recession (Figure 2).
The closest to an exception was in 1966 , when the Federal Reserve hiked and then rapidly cut rates at the onset of a credit crunch and concerns of solvency of savings institutions. While bulls may take comfort from this narrative, it is worth remembering that current CLI momentum is worse than in 1966, and that the Fed then pivoted on real fears about systemic stability. This time around we fear that the global economy has much more room to deteriorate before the Fed comes to the rescue.
Figure 2. CLI Readings and US Recessions
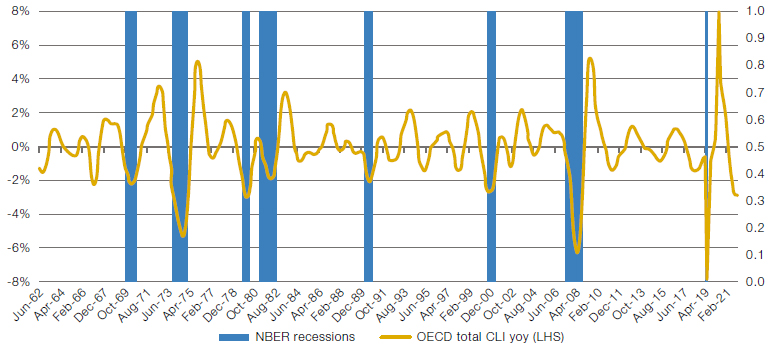
Source: OECD; as of 31 October 2022.
Lilliputian Returns for Shorts
Shorting is but one weapon in the risk management armoury, but it is important.
But nothing in 2022 has been easy. Not even shorting.
The performance of European short interest (the returns to bets against the most heavily shorted European stocks with a market cap of USD1 billion and more than USD5 million in average daily trading volume) has been the worst on record (Figure 3) over one-month trailing returns.
In part, this has been a reaction to the easing of financial conditions, and an underwhelming inflation print: with the Fed’s activity dominating the direction of markets, risk assets have bounced back during the month. The rising tide has lifted all boats, including those who have suffered the most from the re-imposition of a genuine cost of capital.
This will come as small consolation to shorts. With major stock indices up and short positions punished, November has been underlined as an exceptionally tough month for alternative investment strategies.
Figure 3. European Short Interest Performance
Source: Bloomberg; as of 22 November 2022.
With contributions from: Daniel Taylor (Man Numeric – CIO) Eric Wu (Man Numeric – Principal, Quantitative Alpha Integration and Strategy) and Ed Cole (Man GLG – Managing Director of Discretionary Investments)
1. Source: Man Numeric, Russell 1000, Bloomberg.
2. OECD Composite Leading Indicators
3. OECD CLI Zone Aggregation Methodology
You are now leaving Man Group’s website
You are leaving Man Group’s website and entering a third-party website that is not controlled, maintained, or monitored by Man Group. Man Group is not responsible for the content or availability of the third-party website. By leaving Man Group’s website, you will be subject to the third-party website’s terms, policies and/or notices, including those related to privacy and security, as applicable.