A Lack of Confidence, Belied by the Data
UK consumer confidence is at its lowest levels on record (Figure 1). In the mind of the average Brit, things are worse than during the Covid-19 pandemic, the Global Financial Crisis, or the recession of the early 1990s.
But are consumers saying one thing and doing another? The UK Consumer Confidence Index is based on survey data, showing the net difference between positive and negative responses. While negative sentiment outweighs the positive by around 40 percentage points, this is not reflected in consumer spending data (Figure 2). Credit-card data indicate spending has returned to or exceeded pre-pandemic levels across almost all sectors. Interestingly, this trend is reflected across both what might be termed ‘Covid winners’ such as online retailers, electronics companies and homeimprovement stores, and also across ‘Covid losers’ such as airlines, restaurants and bars. In short, while confidence is low, it is yet to filter through to actual spending.
Figure 1. UK Consumer Confidence Index
Problems loading this infographic? - Please click here
Source: Bloomberg; as of 25 May 2022.
Figure 2. Consumer Credit Card Spending With Selected Companies
Problems loading this infographic? - Please click here
Source: Consumer Edge, Man Group; as of 24 May 2022.
All That is Gold Does Not Glitter: Hiking Cycles and Returns
Rate hikes cause volatility: that much is certain. When the cost of capital is repriced, all other securities must be repriced too. The question is how much, and in what direction: up or down?
Traditionally, two asset classes were regarded as being relatively safe havens when rates were rising – gold and equities. However, closer inspection shows that this is not universally true. Examining the eight US hiking cycles since 1970, gold has only meaningfully appreciated during three, staying roughly flat or falling in the remaining five (Figure 3).
A similar story is true for equities, with the S&P 500 Index returning more than 10% during only two of the eight cycles (Figure 4). However, it is worth pointing out that during the 1987 cycle, equities returned almost 20% despite the October 1987 crash being part of that hiking cycle.
Indeed, while gold and equities may be regarded as good hedges against rising rates, their returns are variable rather than glittering. As we discuss in our paper ‘The Best Strategies For Inflationary Times ’, if inflation does force central banks to hike rates, investors may be better served by allocating elsewhere: to alternative strategies such as commodities, momentum equities, and - most importantly - all-asset trend.
Figure 3. Gold Price Changes During Hiking Cycles - 1970-Present
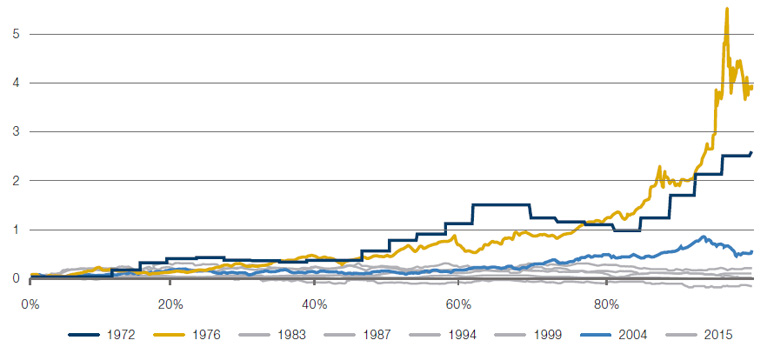
Source: Bloomberg, Man GLG; as of 24 May 2022.
Figure 4. S&P 500 Returns During Hiking Cycles - 1970-Present
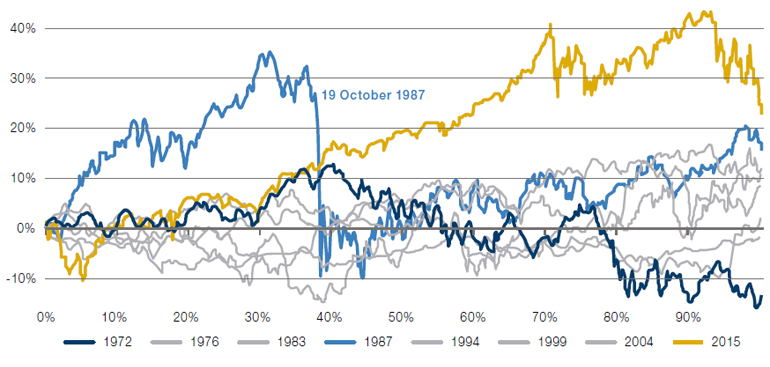
Source: Bloomberg, Man GLG; as of 24 May 2022.
Why the Hong Kong Dollar Peg is not at Imminent Risk
After the Hong Kong Monetary Authority (HKMA’) was forced to intervene by selling dollars to defend the HKDUSD peg, there has been speculation over whether the Hong Kong dollar’s peg to the greenback can be maintained1. In our view, these fears are much exaggerated.
Firstly, the HKMA currently holds US dollar reserves which are larger than the US dollar denominated M1 deposits in the region meaning that there are enough reserves to fully exchange fully all M1 into US dollars at the current levels (Figure 5). As a reminder, M1 deposits include currency, demand deposits and other liquid deposits such as checking accounts. To cause the abandonment of the peg, M2 would have to fall significantly. This would require a significant shock - such as a bank run in which major banks were unable to recall their loans, and required the HKMA to provide Hong Kong dollar liquidity - for a lack of US dollar liquidity to cause the abandonment of the peg.
In fairness, there are some reasons for concern. The ratio between Hong Kong dollar denominated M2 and the aggregate monetary base is growing, meaning that the system is quite levered (Figure 6). If the difference between the monetary base and the M2 grows too high, then in the event of a bank run it will be more difficult to unwind the loans that caused the money supply to grow in the first place.
Nevertheless, we are yet to see a currency peg break when a central bank has enough US dollar reserves to satisfy all outstanding M1 claims.
Figure 5. Hong Kong Monetary Authority – USD Reserves, M1 USD Monetary Aggregate, M2 USD Monetary Aggregate
Problems loading this infographic? - Please click here
Source: HKMA, Bloomberg; as of 24 May 2022.
Figure 6. Hong Kong Dollar – Aggregate Monetary Base Versus M2
Problems loading this infographic? - Please click here
Source: HKMA, Bloomberg; as of 24 May 2022.
With contributions from: Christian Laner (Man GLG – Quantitative Researcher), Gilles Gharios (Man GLG, Head of Investment Risk) and Guillermo Ossés (Man GLG – Head of Emerging Market Debt)
You are now leaving Man Group’s website
You are leaving Man Group’s website and entering a third-party website that is not controlled, maintained, or monitored by Man Group. Man Group is not responsible for the content or availability of the third-party website. By leaving Man Group’s website, you will be subject to the third-party website’s terms, policies and/or notices, including those related to privacy and security, as applicable.