Hedge Trimming
Investors are accustomed to hearing of ‘volatility spikes’. Yet despite the recent weakness in equity markets, we haven’t seen one this year. Figure 1 shows clear jumps in volatility at the start of the pandemic and during the financial crisis, for example.
The past few weeks have, in contrast, been characterised by the CBOE Volatility index (‘VIX’) grinding higher, without reaching true ‘shock and panic’ territory. The same pattern is evident in equivalent volatility gauges for credit, commodities and currencies.
This suggests there has not yet been the kind of capitulation that has generally represented a contrarian buy signal.
Figure 1. VIX Index
Source: Bloomberg; as of 10 May 2022.
Equally, the high volatility witnessed across different asset classes makes it harder to hedge. It may also be triggering some mechanistic de-risking from certain strategies.
This combination of de-risking and challenging hedging conditions arguably explains the weaker demand for puts, illustrated in Figure 2. This portrays skew, a measure of demand for puts versus calls. Although puts are admittedly trading at a high premium in absolute terms, we are not seeing the frantic bids for them over calls that typically happen in a crash. Investors do not appear to be using puts to hedge at any cost.
One interpretation is that people may be monetising their puts and taking profits from existing hedges, rather than adding new ones. The market may have moved from hedging mode to liquidation mode.
Figure 2. Ratio of S&P 500 Puts to Calls
Source: Bloomberg, 3-month 90% implied volatility over 3-month 100% implied volatility; as of 6 May 2022.
Uncharted Territory: Losing Streaks Coincide
Since 1960, there have been 44 individual instances of the S&P 500 index enduring five or more consecutive down weeks. Since 1973, US Treasuries have had 31 such losing streaks lasting at least five weeks.1
Yet these prolonged selloffs had never coincided – until the start of May. For the first time in the near 50 years for which we have both datasets, the two sides of a typical 60/40 US portfolio have lost money for five weeks in a row.
As it has never happened before, we cannot look back for historical guides to what happens next. We can, however, review past experiences following five straight weeks of S&P 500 declines (Figure 3).
As shown, S&P 500 investors would have needed to wait a full year to have a betterthan-50% probability of positive returns after a 5-week losing streak. Even then, further material drawdowns have occurred, with falls of more than 20% in 1969, 2000 and 2001.
Notably, the most recent such 5-week down market came in 2011. Not even the pandemic induced five weeks of S&P 500 losses. In our view, the recent tendency for relatively swift bounces is attributable to the largesse of central banks, which have stepped in swiftly to bolster equity markets for the last decade. However, with inflation running riot, there doesn’t appear to be any such backstop now. This may be supportive for trend-following strategies, but more challenging for contrarian dip buyers.
Figure 3. S&P 500 Index Returns After Five Consecutive Weeks of Losses – 1960 to Last Prior Instance in 2011
Source: Man GLG; as of 10 May 2022.
The Tightrope: Monetary Policy in a Time of Stagflation
If we told you that US imports were rocketing (Figure 4), that there were two jobs available for every unemployed person (Figure 5), and that non-farm payrolls had nearly recovered to their previous levels despite an ongoing pandemic (Figure 6), you’d think that being a central banker was easy, wouldn’t you? The economy is clearly running hot – raise rates.
But there are complications. After the US endured negative growth in the first quarter, labour productivity has cratered (Figure 7), falling some 7.5% in the first three months of the year. With the market for workers as competitive as it has ever been, it is unsurprising that unit labour costs rose by 11.6% during the quarter.
Ultimately, economic growth rests on productivity gains. Without them, rising wages are simply absorbed by rising prices, creating a stagflationary environment. And this would force the Federal Reserve to walk a tightrope: does it raise rates to prevent inflation spiralling out of control? Or does it keep monetary policy relatively loose to try to spark growth?
Figure 4. US Imports
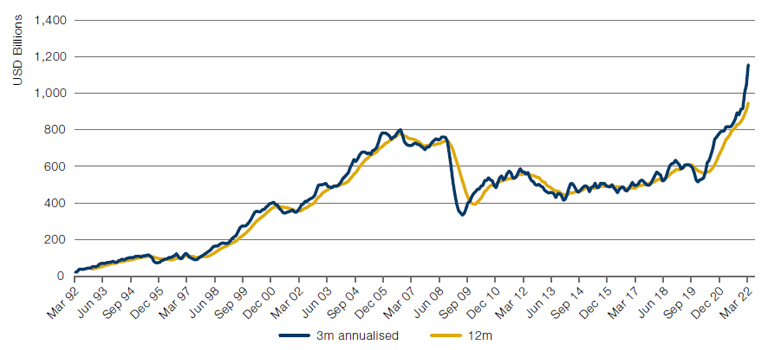
Source: Bloomberg; as of 10 May 2022.
Figure 5. US Vacancy to Unemployed Ratio
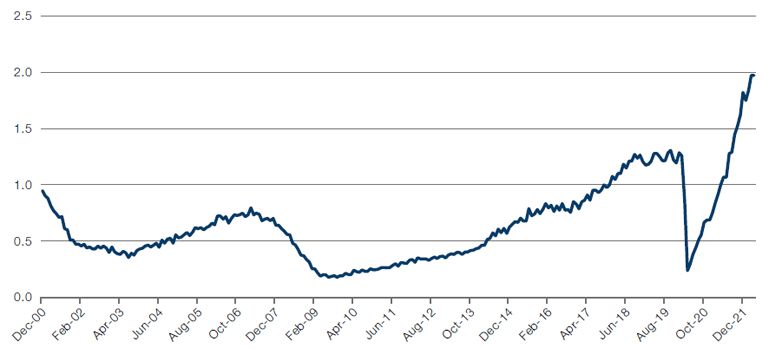
Source: Bloomberg; as of 10 May 2022.
Figure 6. US Non-Farm Payrolls
Source: Bloomberg; as of 30 April 2022.
Figure 7. US Productivity and Unit Labour Costs
Source: Bloomberg; as of 31 March 2022.
Can Valuations Fall Still Further?
2022 has seen a sharp snap back in value dispersion. After value dispersion had stretched to its highest level in 20 years in 2020 – at roughly three standard deviations above normal – dispersion across our US, global and emerging market universes have now fallen roughly 1-1.5 standard deviations wider than normal (Figure 8).
Is a secular shift underway in dispersion?
The lift off in valuation dispersion since 2020 was arguably pandemic driven: expensive growth stocks were seen as relative winners compared to their cheaper value counterparts. While the current selloff has been damaging to many equity investors, it has brought about a renaissance in the Value factor, and dispersion is still well above the average levels of the past decade. And given that monetary policy normalisation may continue apace, it does feel like this revaluation has further room to run.
Figure 8. Combined Valuation Indicator for US, Global, and Emerging Market Equities
Source: Man Numeric; as of 31 March 2022.
With contributions from: Peter van Dooijeweert (Man Solutions, Managing Director – Multi-Asset Solutions), Ed Cole (Man GLG, Managing Director – Discretionary Investments) and Dan Taylor (Man Numeric, CIO).
1. Data sourced from Bloomberg, analysis from Man GLG.
You are now leaving Man Group’s website
You are leaving Man Group’s website and entering a third-party website that is not controlled, maintained, or monitored by Man Group. Man Group is not responsible for the content or availability of the third-party website. By leaving Man Group’s website, you will be subject to the third-party website’s terms, policies and/or notices, including those related to privacy and security, as applicable.