What Rising Oil Prices Mean for Global Growth
Oil prices have been on a wild ride. Russia’s invasion of Ukraine caused Brent crude prices to spike to nearly USD140/barrel, before slumping (Figure 1). Even with the recent decline, crude oil prices are about a third higher than the start of the year.
What does the rise in oil prices mean for global growth? We look at two indicators: the cost of crude oil and terms of trade.
The global cost of crude oil now represents 6% of global GDP, the highest level since the Global Financial Crisis (Figure 2). In addition, the 12-month change in the spending is the most since the Oil Shock, which began in late 1973 (Figure 3). It is worth noting that of the seven recessions experienced since the 1970’s (shaded in grey in Figure 3), four of them have coincided with 12-month spikes in crude oil spending of more than 2% of GDP.
Separately, both the Eurozone and China have seen their terms of trade (calculated as import prices less export prices) deteriorate the most since the mid-1990’s (Figure 4). This isn’t entirely surprising: after all, China and Europe are among the world’s largest energy importers (Figure 5). Both of these regions account for nearly a third of global GDP, and would thus have implications for global growth should the high energy prices persist, causing a sharp slowdown in these two regions.
Figure 1. Oil Prices Have Had a Wild Ride Since Start of Year
Problems loading this infographic? - Please click here
Source: Bloomberg: as of 18 March 2022.
Figure 2. Global Crude Spending as a Percentage of GDP
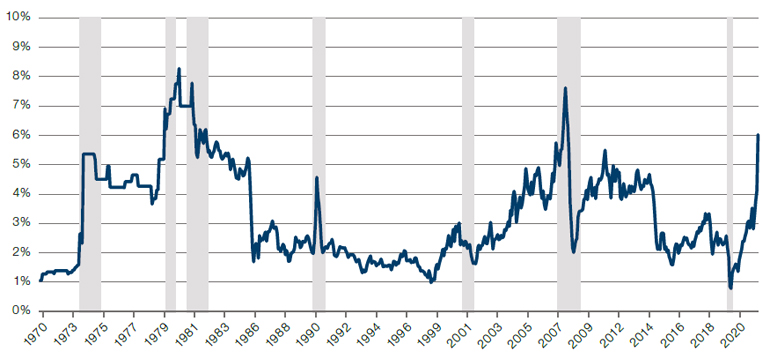
Source: Bloomberg, Man GLG; as of 15 March 2022.
Figure 3. 12-Month Change in Global Crude Spending as a Percentage of GDP
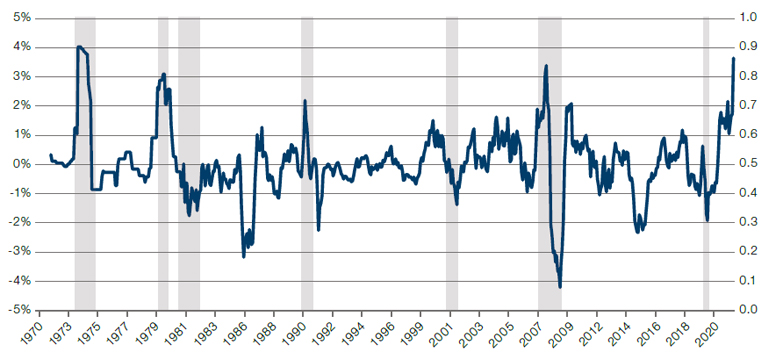
Source: Bloomberg, Man GLG; as of 15 March 2022.
Figure 4. Eurozone and China Terms of Trade
Problems loading this infographic? - Please click here
Source: Bloomberg; as of 17 March 2022.
Figure 5. China and Europe Are the World’s Largest Oil Importers
Problems loading this infographic? - Please click here
Source: BP Statistical Review of World Energy 2021; as of 2020.
What Happens When Emerging Markets Throw in the Towel?
With the ongoing coronavirus infections rates soaring, renewed lockdowns and the Russia/Ukraine war, the case for investing in emerging markets stocks has rarely looked bleaker. Indeed, EM capitulation signals – which isolate periods of extreme negative price movements in the MSCI EM Index – have fired for the first time since 2019 (Figure 6).
Historically, these capitulation signals have been positive for emerging markets: a year after a capitulation signal, the index showed a mean return of 29%, with a 94% hit rate (Figure 7).
There are exceptions to this rule, notably the Global Financial Crisis, when there were a series of capitulation signals before the MSCI EM Index started rising again. In addition, our analysis does not go far enough back to include the oil shock of 1973, which might provide a good comparison for the current situation.
Nevertheless, we see the capitulation trigger as a cause for optimism: history tells us that EM equity returns tend to be strongly positive from here on out.
Figure 6. EM Capitulation Signals Have Started Firing…
Problems loading this infographic? - Please click here
Source: Man GLG, Bloomberg; as of 14 March 2022.
Figure 7. …Which Have Historically Been Positive for Forward Returns in the MSCI EM Index
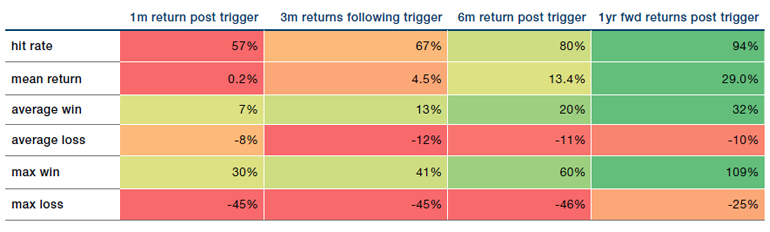
Source: Man GLG, Bloomberg; as of 14 March 2022.
With contribution from: Ed Cole (Man GLG, Managing Director – Discretionary Investments)
You are now leaving Man Group’s website
You are leaving Man Group’s website and entering a third-party website that is not controlled, maintained, or monitored by Man Group. Man Group is not responsible for the content or availability of the third-party website. By leaving Man Group’s website, you will be subject to the third-party website’s terms, policies and/or notices, including those related to privacy and security, as applicable.