Gauging Investor Sentiment
Everyone’s heard the Buffetism of being greedy when others are fearful. Some metrics suggest that such a time is now. In the wake of Russia’s invasion of Ukraine, the AAII Bulls Minus Bears survey has fallen to -301, lower than it was even at peak-Covid in 2020. Bloomberg’s US Consumer Comfort gauge is also close to those levels of pessimism, while NFIB’s US Small Business report is at its most depressed since the onset of third lockdowns at the start of 2021. That’s the thing about the (even very distant) prospect of nuclear war: it’s a bit scary, to use British understatement.
So, with sentiment this washed out, could it be the time to be taking advantage of market fear?
It does seem likely that an unexpected diplomatic fudge would precipitate a sharp relief rally given the level of current pessimism. We are a little hesitant to chase this scenario, however, and are mindful of the 9/11 analogue. In the 12 months preceding that tragic day, the S&P 500 fell 37% due to concerns around steep valuations in the context of an anticipated recession. In the week following the atrocity, stocks fell 13% in short order as the market struggled to get its head around the full ramifications of what the attack might mean for geopolitics. In the six months after that, however, as the situation normalised, the relief rally exceeded the magnitude of the 9/11-precipitated decline, with the S&P 500 rising 21%. But by that point enough time had elapsed that the market ‘remembered’ what it was worried about in the first place – excessive valuations and the prospect of recession – and reverted to its prior path, falling a further 34% through to October 2002.
It is possible that a similar scenario could open up today in the event of an unexpected peace deal. A sharp relief rally as depressed sentiment normalises, followed by a reremembering of prior concerns: in this case, persistent inflation and the potential policy reaction. It is worth noting that the market started the year pricing in three 25-basis point Fed hikes for 2022. Up to 11 February – which we would date as the start of the Russia-Ukraine tensions domination of the headlines – this had moved to six hikes and has since remained flat.
So, it’s not like the market was in an age of innocence prior to the invasion, and any relief rally should take that into consideration.
Oil: Backwardation Looks Bleak
What a difference two years makes.
This time in 2020, we were watching oil futures slide below zero. Now, WTI crude is at USD113 per barrel.
But those who hope that we will see mean reversion may be disappointed. The spread in backwardation between 1-month and 6-month WTI futures has almost reached USD16, an all-time high (Figure 1). Backwardation is when the current price of an underlying asset is higher than prices trading in the futures market. This implies that if investors buy longer-dated futures and hold the position, they will make money, as the futures price slowly converges to match the spot price – as long as the curve stays in backwardation. Backwardation in futures markets is relatively normal, and fluctuates with supply and demand.
In 2020, when the futures price turned negative, so did the backwardation spread: at that point, the money-making strategy was to buy the physical oil at spot, store it and sell it forward. The difficulty was that there was very little storage available at the time. Now that the price is rising, a positive spread has returned. But the size of the discrepancy between short-term and longer-term futures is unprecedented, implying that the market supply is at its tightest versus demand.
With such sentiment, it is hard to see the oil price moderating anytime soon.
Figure 1. WTI Futures Backwardation Spread – 1-Month Minus 6-Month Spread
Source: Bloomberg; as of 4 March 2022.
Safe as Houses?
In 2021, US house prices surged 19% in nominal terms, the third-highest since 1891. Only 1944, 1946 and 1947 able to best 2021 in nominal terms (Figure 2).
In real terms, US house prices increased 11%. Gains were evenly distributed across the continental US. Of the 20 cities listed in the Case-Shiller Index, all were at all-times highs at the end of 2021.2
Why the strong performance? Firstly, housing enjoys structural support. While housing permits and new starts are on the rise, they are still below levels achieved in 2007 (Figure 3). In contrast, the US population has grown by around 34 million people since then, creating a situation of long-term undersupply. In addition, we are in an inflationary environment that is generally supportive of real assets. Indeed, the postwar parallels are striking: we are enduring similar levels of financial repression, with real rates of -7%, forcing investors to move out of cash.
Despite supportive fundamentals, our overall positive outlook is somewhat tempered by a slowing mortgage market: the average 30-year mortgage rate has risen sharply and now stands at 3.89%, as banks anticipate rate hikes (Figure 4), while mortgage applications are declining.3
Figure 2. US National Home Price Changes (1891-2021)
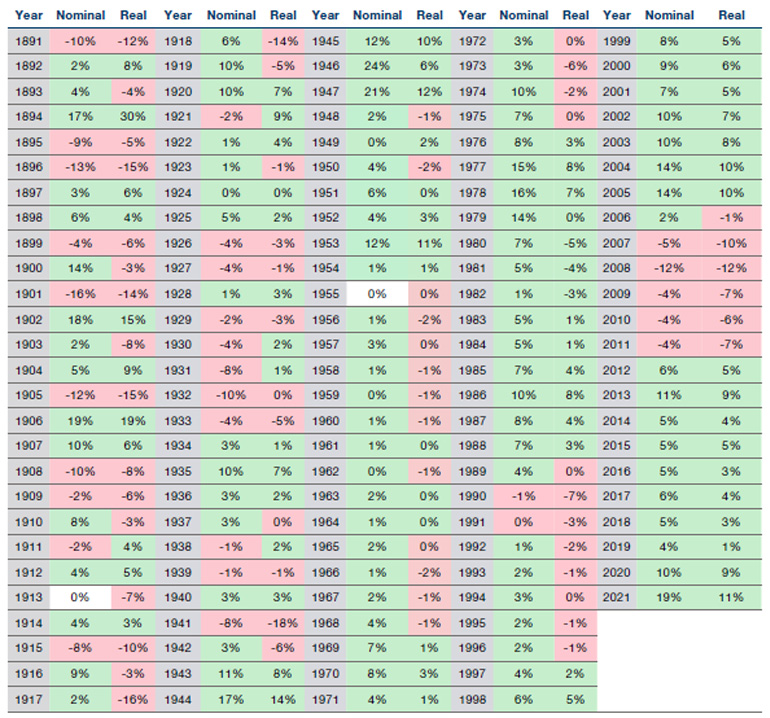
Source: Dr Robert J. Shiller; as of 31 December 2021.
Figure 3. US Housing Starts Versus US Housing Permits (Seasonally Adjusted Average)
Source: US Census Bureau; as of 3 March 2022.
Figure 4. US Average 30-Year Fixed Mortgage Rate
Source: Federal Reserve Bank of St Louis; as of 3 March 2022.
With contributions from: Henry Neville (Man Solutions, Analyst) and Gilles Gharios (Man GLG, Head of Investment Risk)
1.Source: Bank of America Merrill Lynch.
2.Bloomberg.
3.Mortgage applications fell by 11% in December, according to JP Morgan.
You are now leaving Man Group’s website
You are leaving Man Group’s website and entering a third-party website that is not controlled, maintained, or monitored by Man Group. Man Group is not responsible for the content or availability of the third-party website. By leaving Man Group’s website, you will be subject to the third-party website’s terms, policies and/or notices, including those related to privacy and security, as applicable.