US Earnings: Do CEOs or Analysts Know Better?
Corporate managers typically pitch an optimistic vision to sell-side analysts. Yet a recent survey of US chief executives found that their confidence in the economy had plunged in the second quarter, to its lowest levels since the start of the pandemic. Given the prevailing macro uncertainty, that isn’t necessarily very surprising.
However, this pessimism is in stark contrast to the remarkable resilience we are seeing in US earnings forecasts (Figure 1). At no point between now and late 2023 do year-on-year quarterly earnings estimates give any sense of recession; instead it looks like business as usual.
Importantly, this aggregate positivity isn’t concentrated in just a few sectors - it is evident across the whole S&P 500 Index (Figure 2). Energy and materials remain positive despite some mean reversion, while the larger contributors to index earnings – sectors like technology, communications services and consumer discretionary that powered US equities through the bull run – look strong.
For further meaningful downside in US stocks, we probably need earnings to roll over in a way that Wall Street does not seem to expect over the next 18 months.
So why might CEOs be so gloomy? Another point raised in the survey may provide a clue. Asked how they would deal with rising input costs, 54% said they would pass higher prices on to customers. It’s possible that may sustain earnings for a while. But if supply bottlenecks ease and growth slows such that companies lose this pricing power, corporate margins will come under pressure.
Figure 1. Year-on-Year S&P 500 Operating Earnings Forecasts
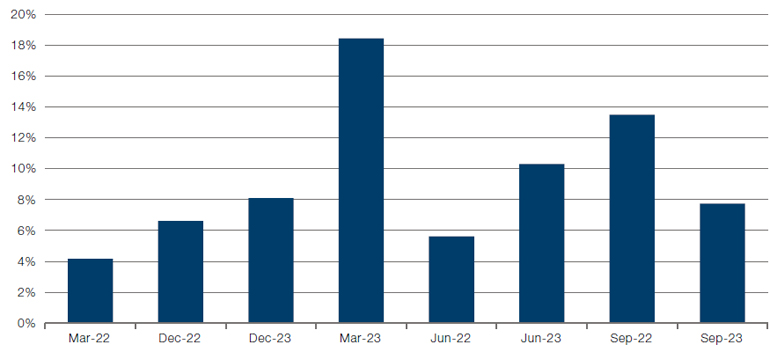
Source: S&P Dow Jones Indices; as of 2 June 2022.
Figure 2. Estimated Contribution to Quarterly S&P 500 Operating Earnings
Problems loading this infographic? - Please click here
Source: S&P Dow Jones Indices; as of 2 June 2022.
What’s In the Price? Mapping Market Fears Via Natural Language Processing
Building an accurate map of what market participants are expecting is a key factor in building a successful investment strategy. However, doing so is not always easy for every financial instrument: for every stock where we have short-interest data or for every market-implied probability given for the path of interest rates, there are many important economic events for which no reliable proxy of market opinion exists.
One way to bridge the gap is to use natural language processing, a form of machine learning which analyses text data. We have taken four phrases which capture negative sentiment on important economic topics (“recession”, “policy mistake”, “bear market rally” and “hiring freeze”) and then computed the number of news articles in which these occur (Figure 3). As we can see, there have been sharp increases in discussions regarding recession and hiring freezes, with the former leading the latter by two to three months. As one might expect, discussions about bear market rallies are relatively infrequent, although their count has soared based on recent price moves. From this, we think it is reasonable to infer that recession, a slowdown in job markets and the latest stock market rally are already ‘in the price’.
What is counterintuitive is the simultaneous drop in news articles referring to a monetary policy error. While inflation may moderate under tighter financial conditions, a recession would indicate that monetary policy had tightened too much. In our view, this indicates something about rationality: even as recessionary fears grow, Mr Market is paradoxically less worried about the monetary policy that may cause it. Baffling.
Figure 3. News Article Phrase Count - “Recession”, “Policy Mistake”, “Bear Market Rally” and “Hiring Freeze”
Problems loading this infographic? - Please click here
Source: Man Group, Bloomberg; as of 7 June 2022.
New Worlds, Old Worlds: Sector Differences in Europe and the US
We often speak as if the world’s economy is homogenous: commodities are up, bonds are down and stocks have gone around circles. But even though very few geographies are entirely insulated from macroeconomic events in a globalised economy, the world is not so interconnected that markets react uniformly to similar stimuli.
Figure 4 shows the year-to-date returns various sectors of the S&P 500 and the STOXX Europe 600 indices. If the returns vary by less than 5%, or if both returns are within a -5%/+5% range, then the sector is highlighted in green.
The key areas of difference are energy, basic materials, banking, autos, and media. The former is possibly the least intuitive initially, with US energy stocks up around 33 percentage points more than their European counterparts – even though energy prices are much higher in Europe than the US. The discrepancy in materials and basic resources between Europe and the US is driven by UK miners who have performed strongly in 2022. Likewise, European banks – for years the runt of the litter – are roughly flat, even as US banks fell 14%. In the latter case, it is interesting to see the differing impacts of rising inflation. Whereas inflation may finally spark monetary policy normalisation in Europe, and with it an increase in net interest income as margins on loans rise, inflation has not been positive for US banks. Indeed, this reaction bears out our own analysis, which shows that increased interest income in an inflationary environment is potentially cancelled out by higher default risk. This is not the case in Europe, where rates have been at zero for much of the past decade - any rate hike whatsoever provides an immediate boost to net income without a meaningful hike in the prospect of default.
Figure 4. Sector Returns - S&P 500 and the STOXX Europe 600 Indices
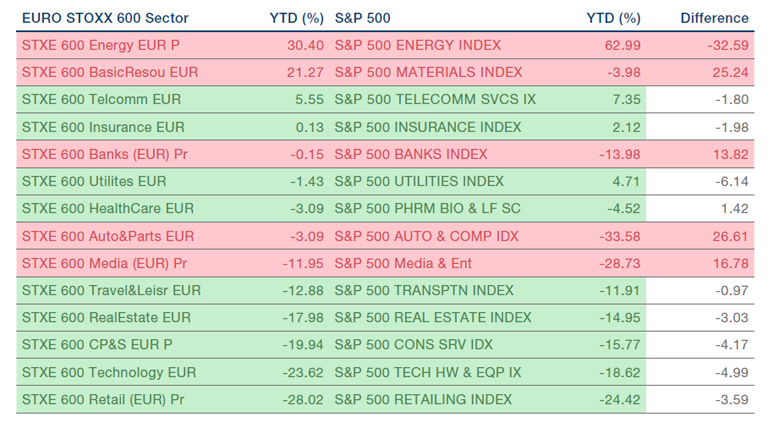
Source: Bloomberg; as of 7 June 2022.
You are now leaving Man Group’s website
You are leaving Man Group’s website and entering a third-party website that is not controlled, maintained, or monitored by Man Group. Man Group is not responsible for the content or availability of the third-party website. By leaving Man Group’s website, you will be subject to the third-party website’s terms, policies and/or notices, including those related to privacy and security, as applicable.