Follow the Money: The Coming Inflation Slowdown?
When it comes to inflation, should investors take a lesson from All The President’s Men and follow the money?
The “quantity of money” theory states that the quantity of money multiplied by the velocity of money is equal to the quantity of goods and services multiplied by the price level (with the right-hand side of the equation more easily understood as real GDP). This can be stated as:
M x V = Q x P
In our view, this is directly applicable to the current inflationary situation in the US. Since the second quarter of 2020, M2 has grown by about 11% annualised, with 100% of this increase driven by the increase in commercial bank deposits (Figure 1). Traditionally, banks create deposits to match loan growth. As loan growth increases, so does the velocity of money, as measured by M2 divided by GDP. While at the end of 2021, commercial deposits were growing by 10% year-on-year, the rate of growth has now slowed to around -4%. Assuming deposits continue to slow vs nominal GDP, and that M2 doesn’t get a lift from other components (notes in circulation, money market funds) velocity is likely to slow, which is significant, as we can see from Figure 2 that the increase or decrease in the velocity of money leads inflation quite durably, by around five quarters.
To contribute further to the case for moderating inflation, US house prices inflation may have peaked (Figure 3). Again, this metric is a lead indicator for inflation. Owners’ equivalent rent comprises some 24% of the US CPI basket, and tends to follow US house prices with a four-to-six quarter lag1.
All in all, while US inflation may remain high in the short term, there is an argument to be made that we will see moderation in the medium term.
Figure 1: US Commercial Bank Deposits (12-Month Change in the 3-Month Moving Average)
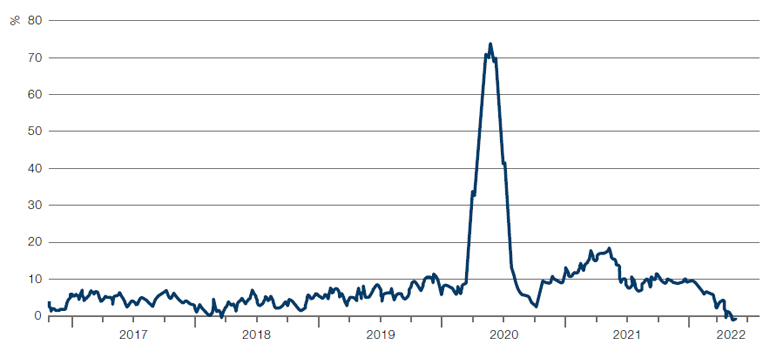
Source: Bloomberg; as of 31 May 2022.
Figure 2: Velocity of Money Versus Inflation
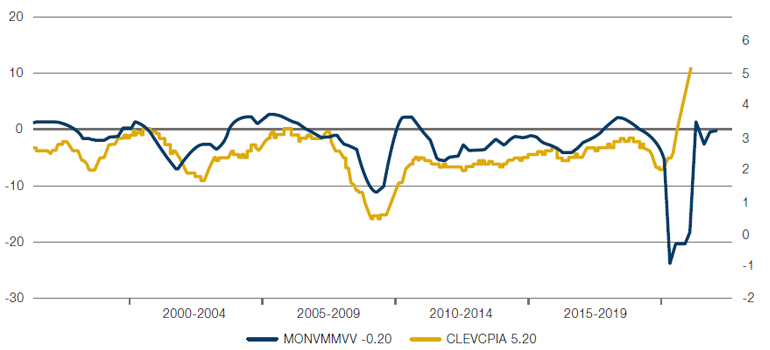
Source: Bloomberg; as of 31 May 2022.
Figure 3: House Prices Versus Owners Equivalent Rent
Problems loading this infographic? - Please click here
Source: Bloomberg; as of 31 May 2022.
The Glass of Fashion: What Positions Are Trendy?
Discovering what is in fashion is never an easy task – as a quick walk around our trading floor will immediately tell you. Happily, it is somewhat easier to identify which assets are trending.
To do this, we run a regression model on the Société Générale Trend Index to glean what we think are commonly held trend-manager positions. Currently the trend signals point to short US Treasuries, long commodities, long US dollar, and short equities – all trades that have done well in 2022 (Figure 4).
We have noted that traditional pure trend strategies, with exposure to macro instruments such as equity index, government bond, and commodity futures have performed more strongly than ‘alternative’ trend strategies, which often trade more over the counter options in less liquid markets. All trend returns are driven to a large extent by volatility – without volatility there are of course no trends to follow. But alternative trend strategies tend to utilise a higher degree of diversification when generating their returns, which means that when macro trends are strong and concentrated in specific markets – as they have been in 2022 – traditional, more concentrated pure trend strategies tend to outperform. Risk managers therefore have a delicate balance to strike, between concentration and over-exposure to the main themes of the year.
Figure 4: Société Générale Trend Index Versus the S&P 500 Index
Problems loading this infographic? - Please click here
Source: Bloomberg; as of 22 May 2022.
With contributions from: Ed Cole (Man GLG, Managing Director – Discretionary Investments), Jonathan Daffron (Man FRM, Deputy Head of Investment Risk) and Graham Robertson (Man AHL, Partner and Head of Client Portfolio Management).
1. https://www.bls.gov/cpi/tables/relative-importance/2021.htm
You are now leaving Man Group’s website
You are leaving Man Group’s website and entering a third-party website that is not controlled, maintained, or monitored by Man Group. Man Group is not responsible for the content or availability of the third-party website. By leaving Man Group’s website, you will be subject to the third-party website’s terms, policies and/or notices, including those related to privacy and security, as applicable.