What Happens When the NASDAQ Tanks?
The NASDAQ index is experiencing its worst ever start to the year.1 At the time of writing, the index is down by some 14% year-to-date, and has closed down in seven out of the past nine weeks.
What might this mean for future performance?
While year-to-date performance is unprecedented, the current condition of seven down weeks out of nine has occurred 99 times during the NASDAQ’S life, comprising 4% of sample returns going back to 1980.
Even though the current position is dire, typical 2-month forward returns from this point are reasonably strong (Figure 1). Absolute returns are positive 81% of the time, with a mean return of 7.3%. However, the full data set includes a unique event: the bursting of the tech bubble in 2001. Between 2000-2002, the data still show a similar pattern. Absolute returns are still positive in 81% of cases, with mean returns even higher at 11.1%.
Of course, there is no guarantee that the NASDAQ will recover quite so strongly in 2022, with the current policy backdrop possibly making this year an exception to the previous rule. But by and large, history broadly favours a good NASDAQ bounce in the short term.
Figure 1. Two-Month Forward Returns When NASDAQ Index Down in Seven of Previous Nine Weeks

Source: Man GLG, Bloomberg; as of 26 January 2021.
The Comeback: Long-Term Losers Recover
Was 2021 the end of an era?
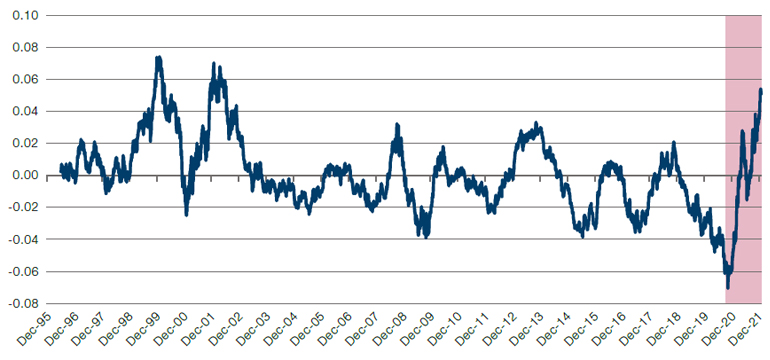
Figure 2 shows the rolling 12-month performance of the Long-Term Reversal factor in the US. This compares the returns of the best- and worst-performing stocks of the previous five years, excluding returns to 1-year Momentum, and thus isolating the extent to which longer-term trends are changing.2 A high reading means that a reversal is underway and previous losers are performing strongly. Conversely, a low reading means that previous trends are continuing.
While we are not yet at all-time highs for the factor, investors have experienced the biggest overall swing in the data set. In the space of a year (highlighted in Figure 2), the dominance once enjoyed by mega-cap tech and Growth stocks has almost entirely reversed, with previous losers approaching the outperformance they enjoyed when the tech bubble burst in 2001.
Figure 2. US Long-Term Reversal Factor

Source: Bloomberg, Man GLG; as of 26 January 2022.
US Breadth is Back, But Mega Caps Still Dominate
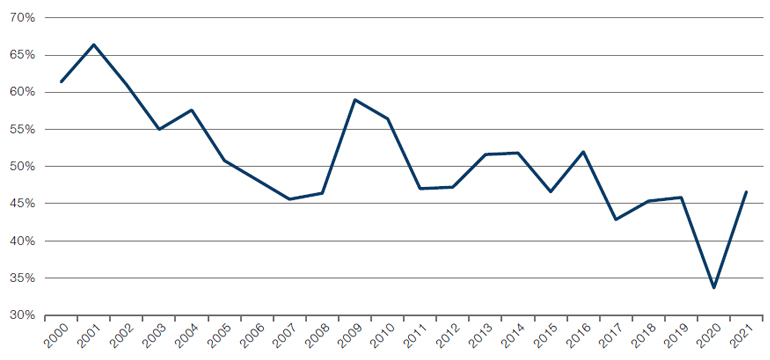
By most standards, 2020 was extreme. This was as true for the breadth of returns as it was for many other factors: as normal life shut down, a relatively small band of winners hoovered up returns and were able to outperform the S&P 500 Index (Figure 3).
In relative terms, 2021 was more normal. Nearly half of all stocks in the index outperformed on a market cap-weighted return basis, and the difference in returns between a cap-weighted and equally weighted index was less than 1% (Figure 4).
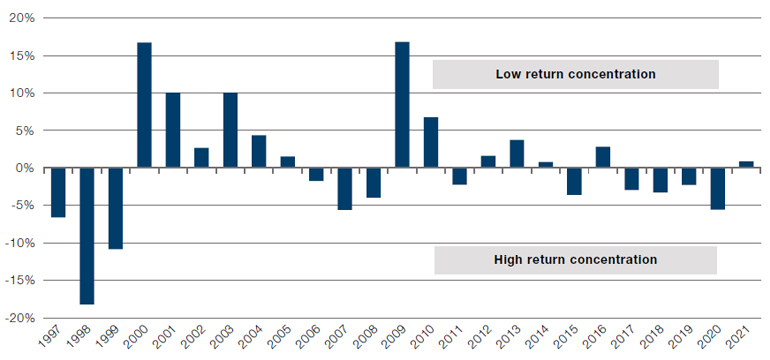
While mega-cap stocks represent a smaller percentage of outperformers, they do still contribute more than their fair share of returns. Figure 5 shows the gross return of the index with and without the top 10 contributors. Excluding the top 10 would have shaved 6% from the S&P 500’s performance in 2021 – the second-biggest gap since 2000. Breadth may have returned in 2021, but the performance of the US stock market is still enormously reliant on mega-cap tech.
Figure 3. Percentage of S&P 500 Index Constituents Outperforming Index Cap-Weighted Return

Source: Man Numeric, Bloomberg; as of 31 December 2021.
Figure 4. Return Gap Between Equal and Cap-Weighted S&P 500 Index Returns

Source: Man Numeric, Bloomberg; as of 31 December 2021.
Figure 5. Difference in S&P 500 Gross Returns Ex-Top 10 Performers
Source: Man Numeric, Bloomberg; as of 31 December 2021.
With contributions from: Ed Cole (Man GLG, Managing Director – Discretionary Investments) and Dan Taylor (Man Numeric, CIO)
1. As of 28 January 2022.
2. www.msci.com/documents/1296102/6508581/VictorVilla_AjinderBanns_Workshop_Stream1.pdf/59703593-fa3c-48c0-81aa-7af3362fa6de?version
You are now leaving Man Group’s website
You are leaving Man Group’s website and entering a third-party website that is not controlled, maintained, or monitored by Man Group. Man Group is not responsible for the content or availability of the third-party website. By leaving Man Group’s website, you will be subject to the third-party website’s terms, policies and/or notices, including those related to privacy and security, as applicable.